Chapter 1 Introduction
Multiple sclerosis (MS) is an auto-immune disease characterized by demyelination, inflammation and axonal loss in the central nervous system (CNS). It affects mostly young adults (average age of diagnosis is 32 years), and there are twice as many women than men with MS. Worldwide, there are approximately 2.9 million people with MS with a prevalence in the Netherlands of ~210 per 100.000 people [1]. Depending on the regions within the CNS involved, symptoms can include visual symptoms (when the optic nerve is involved), fatigue/cognitive problems (brain), motor/sensory disturbances (brain/brainstem/spinal cord), coordination problems/ataxia (brainstem/spinal cord) and bladder/bowel/sexual dysfunction (spinal cord, in lesser degree brain).
There are three main subtypes of MS: Relapsing-remitting MS (RRMS) is most prevalent (~85%) in which relapses occur followed by (partial) remittance [2], which can eventually convert to secondary-progressive MS (SPMS; 25 - 50% after 15 years [3, 4]) where relapses stop or become less and gradual progression of symptoms is more prominent. Finally, there is primary-progressive MS (~15%) where there is a progressive onset and there are no (or seldom) relapses, only gradual progression of symptoms [2]. However, patients with RRMS can also have progression of disability independent of relapses (PIRA) and, vice versa, patients with PPMS can have relapses. Therefore the modifiers active/inactive (relapses and new lesions on MRI) and with/without progression (disability accrual without relapses or new lesions) have been introduced as addition to these subtype labels to better cover the spectrum of MS phenotypes (replacing older descriptions like progressive-relapsing MS) [5]. The purpose of defining these subtypes is to be able to delineate groups for clinical studies and consequently for the scope of the indication of a therapy. Because, currently registered DMTs are effective for active disease, but not for progressive disease. In the next section, the pathophysiological concepts behind the distinction of active and progressive disease will be further explained.
1.1 Pathophysiology
Diving into literature on MS pathophysiology feels like reading through an extensive series of detective novels. We know a lot about the actors, the circumstances at the scene and possible weapons used, but in the end the exact answer to the question “Who has done it?” and “How did this happen?” remains a mystery and even after reading the latest part in the series there are still multiple theories. Here, I will share a short summary on what we do know and what is currently on the pin board that is overloaded with red string.
The victim of the story is the neuron within the CNS and primarily its myelin sheets (necessary for fast conduction of signals through the neuron, produced by oligodendrocytes), a process called demyelination (figure 1.1). This is mainly seen within focal inflammatory lesions, where in these lesions we have present at the scene: Monocytes/microglia containing myelin degradation products and in a lesser degree T and B cells [6]. But why are they there and how did this scene form? These lesions occur against a background of inflammation starring B- and T-lymphocytes [7]. T helper cells (CD4+ T cells, which normally have an important role in protection against infections) in MS are associated with the activation and maturation of the aforementioned CNS-resident microglia and CNS-invading monocytes [8]. Hence, traditionally, MS has been seen as a T cell-mediated disease where there is a disrupted balance between pro- and anti-inflammatory T cell subsets. But then there was a plot twist! Antibodies against CD20 (a surface molecule on B lymphocytes) were found to have the striking ability to reduce new MS relapses [9]; a new suspected accomplice at the scene. While it could be imaginable that plasma cells (a cell lineage of B lymphocytes) produce auto-antibodies against parts of myelin, a central auto-antibody in MS was never identified. Also, interestingly, CD20 is present on all B cells except for antibody producing B cells [10]. Hence, the contribution of B cells to the inflammatory disease activity is antibody-independent, in the form of antigen presentation to other lymphocytes and/or the secretion of pro/anti-inflammatory cytokines (‘communication’ molecules of the immune system) [10].
![Figure 1.1 - Simplified schematic illustration of key components in MS pathophysiology. (1) Antigen-presenting cells (e.g. macrophages, B cells or dendritic cells) present a CNS-specific antigen to T helper cells causing them to be sensitised to a host CNS protein. (2) T helper cells migrate into the circulation and eventually past the blood-brain-barrier, producing pro-inflammatory cytokines leading to the recruitment of effector cells (T effector cells, B cells and macrophages). Additionally, CNS-resident microglia are activated. (3) The effector cells and microglia through different mechanisms cause the breakdown of myelin. During this process there also is partial remyelination. (4) In chronic active or smouldering lesions, there are much less T and B cells, but microglia and macrophages remain active causing further demyelination (mainly at lesion borders) and finally also axonal loss. The microglial activation probably also contributes to the failure of oligodendrocytes to remyelinate neurons [6, 10, 11].](img/fig_patho.png)
Over the years therapies vastly improved at reducing relapse activity and the formation of new lesions as measured on MRI (inhibiting active disease). However, despite the inhibition of relapses and new lesions, many patients still show gradual progression of disability (progressive disease). This phenomenon has been given the term ‘progression independent of relapse activity’ (PIRA), and while MS mostly starts with a relapsing-remitting disease course (RRMS; see figure 1.2), many eventually move towards a secondary progressive course (SPMS) where the gradual progression is more prominent, which can be with or without superimposed relapses.
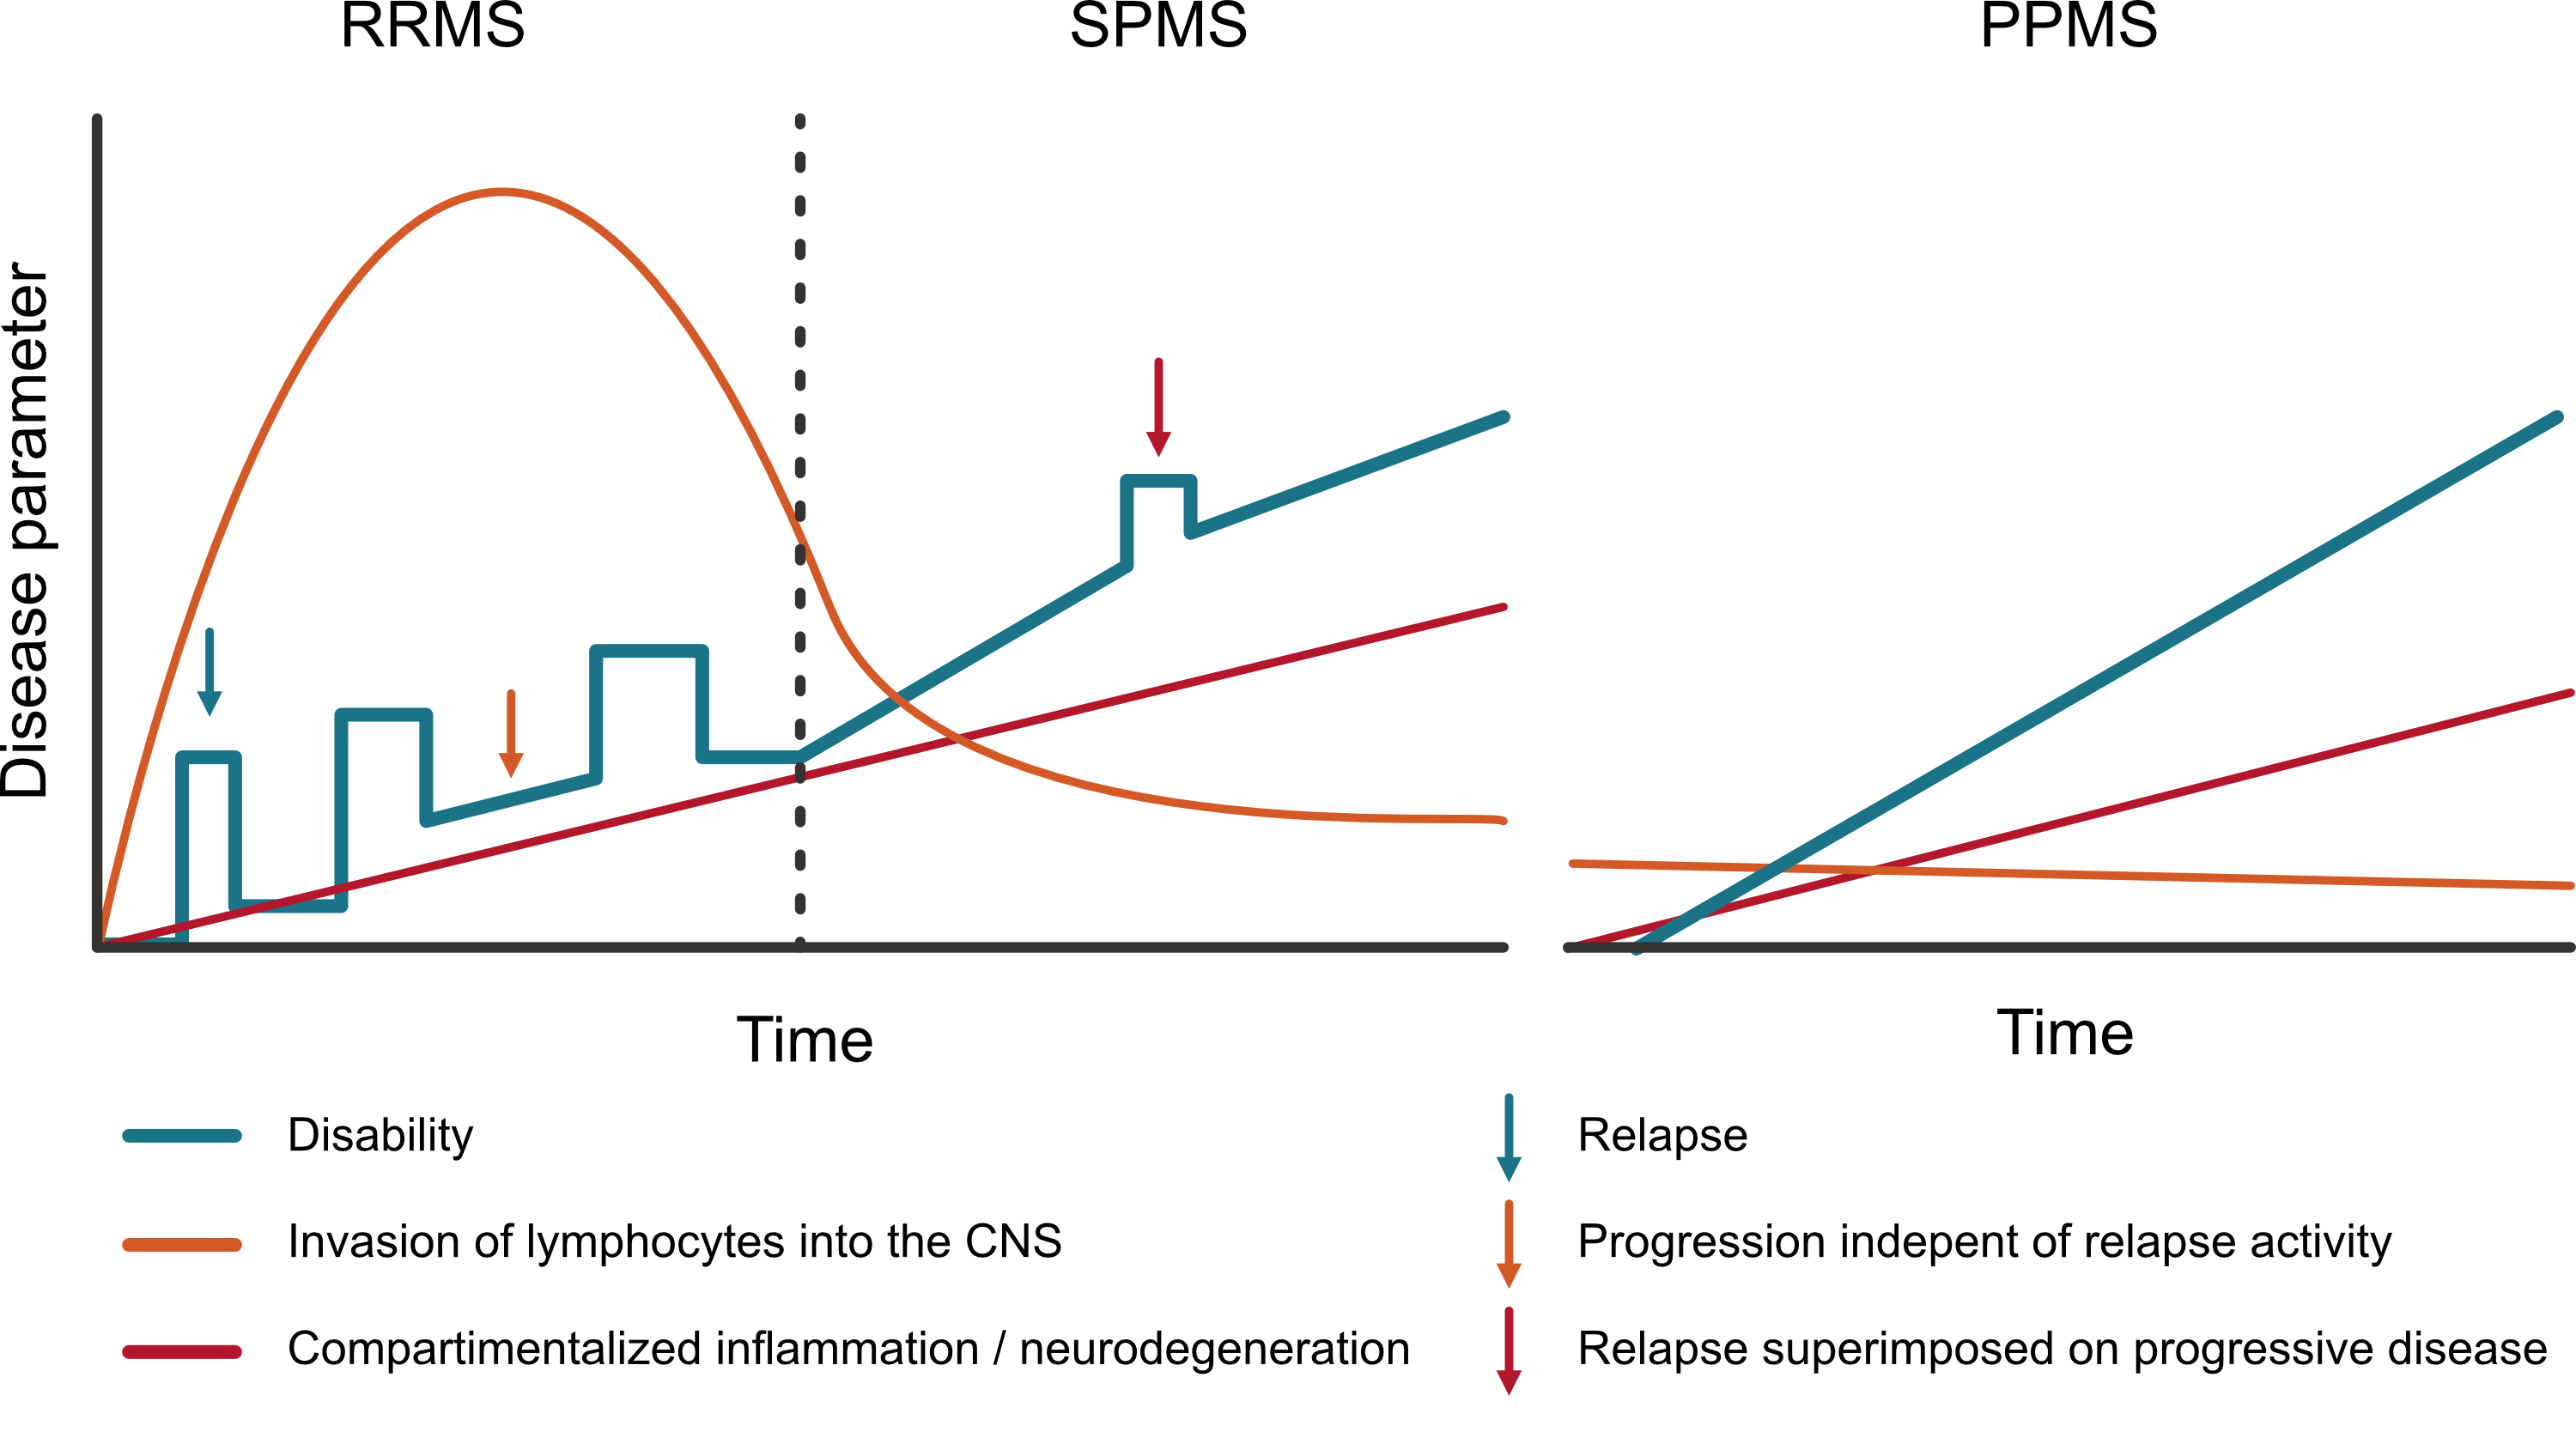
So, while modern MS therapies seem potent in reducing the systemic immune response driving the bouts of inflammation causing relapses and focal lesions, there are also lesions that remain chronically active causing ongoing ‘smouldering’ inflammation which we can’t yet control with the current therapies. This smouldering inflammation is the result of chronically activated microglia and recruited macrophages within the CNS tissue which in turn produce proinflammatory cytokines [12] (figure 1.1). Additionally, B cell–rich aggregates of immune cells in the meninges surrounding the brain and spinal cord seem to persist [13]. This smouldering inflammation is compartmentalized within the CNS and therefore hard to target with systemic therapies.
So why does all this happen? What is the initial trigger in the cascade of events? Or is it an unfortunate perfect storm of circumstances? Evidence to date shows a combination of environmental, genetic, and epigenetic factors to have a causal role in MS which potentially interact with modifiable risk factors. An Epstein-Barr virus (EBV) infection has always been high on the suspect list since an infection with EBV has important effects on the immune system. EBV establishes a long-term latent infection of B lymphocytes. This initiates a developmental process in naive B lymphocytes resulting in long-lived memory B cells containing the EBV viral genome. Lifelong persistence occurs through the establishment of latent reservoirs in these cells with periodic reactivation [14]. In MS pathogenesis there is an ineffective control of EBNA-1-mediated (EBV nuclear antigen 1) autoimmune response and molecular mimicry between EBNA-1 and CNS glial cell adhesion molecule (GlialCAM; a molecule expressed on mainly astrocytes and oligodendrocytes in our CNS) [15]. In a study with more than ten million US army personnel being followed up over 20 years, there was a 32-fold increase in risk of an MS diagnosis in individuals who converted to EBV seropositivity compared with those who remained seronegative [16]. However, 95% of the general population has an EBV infection at some point in their lives (as shown by the presence of EBV antibodies) [16] and only a fraction develops MS. In contrast to EBV, a previous cytalomegalovirus (CMV) infection (through certain natural killer cell subsets [15]) is associated with better control of autoreactive cells against GlialCAM and in observational studies there seems a moderately lower prevalence of MS in people with a prior CMV infection [16]. So an EBV infection is certainly not the whole story, but it is plausible that it is a prerequisite in developing MS. Other main environmental factors associated with MS are a vitamin D deficiency and smoking.
Lastly, genome-wide association studies have shown a large variety of genetic risk loci that are associated with developing MS. These risk genes lie mostly within the human leukocyte antigen (HLA) complex genes [8]. In practice, this translates to a lifetime risk in first-degree relatives of MS patients of around sevenfold compared to the general population [17].
1.2 Diagnosis
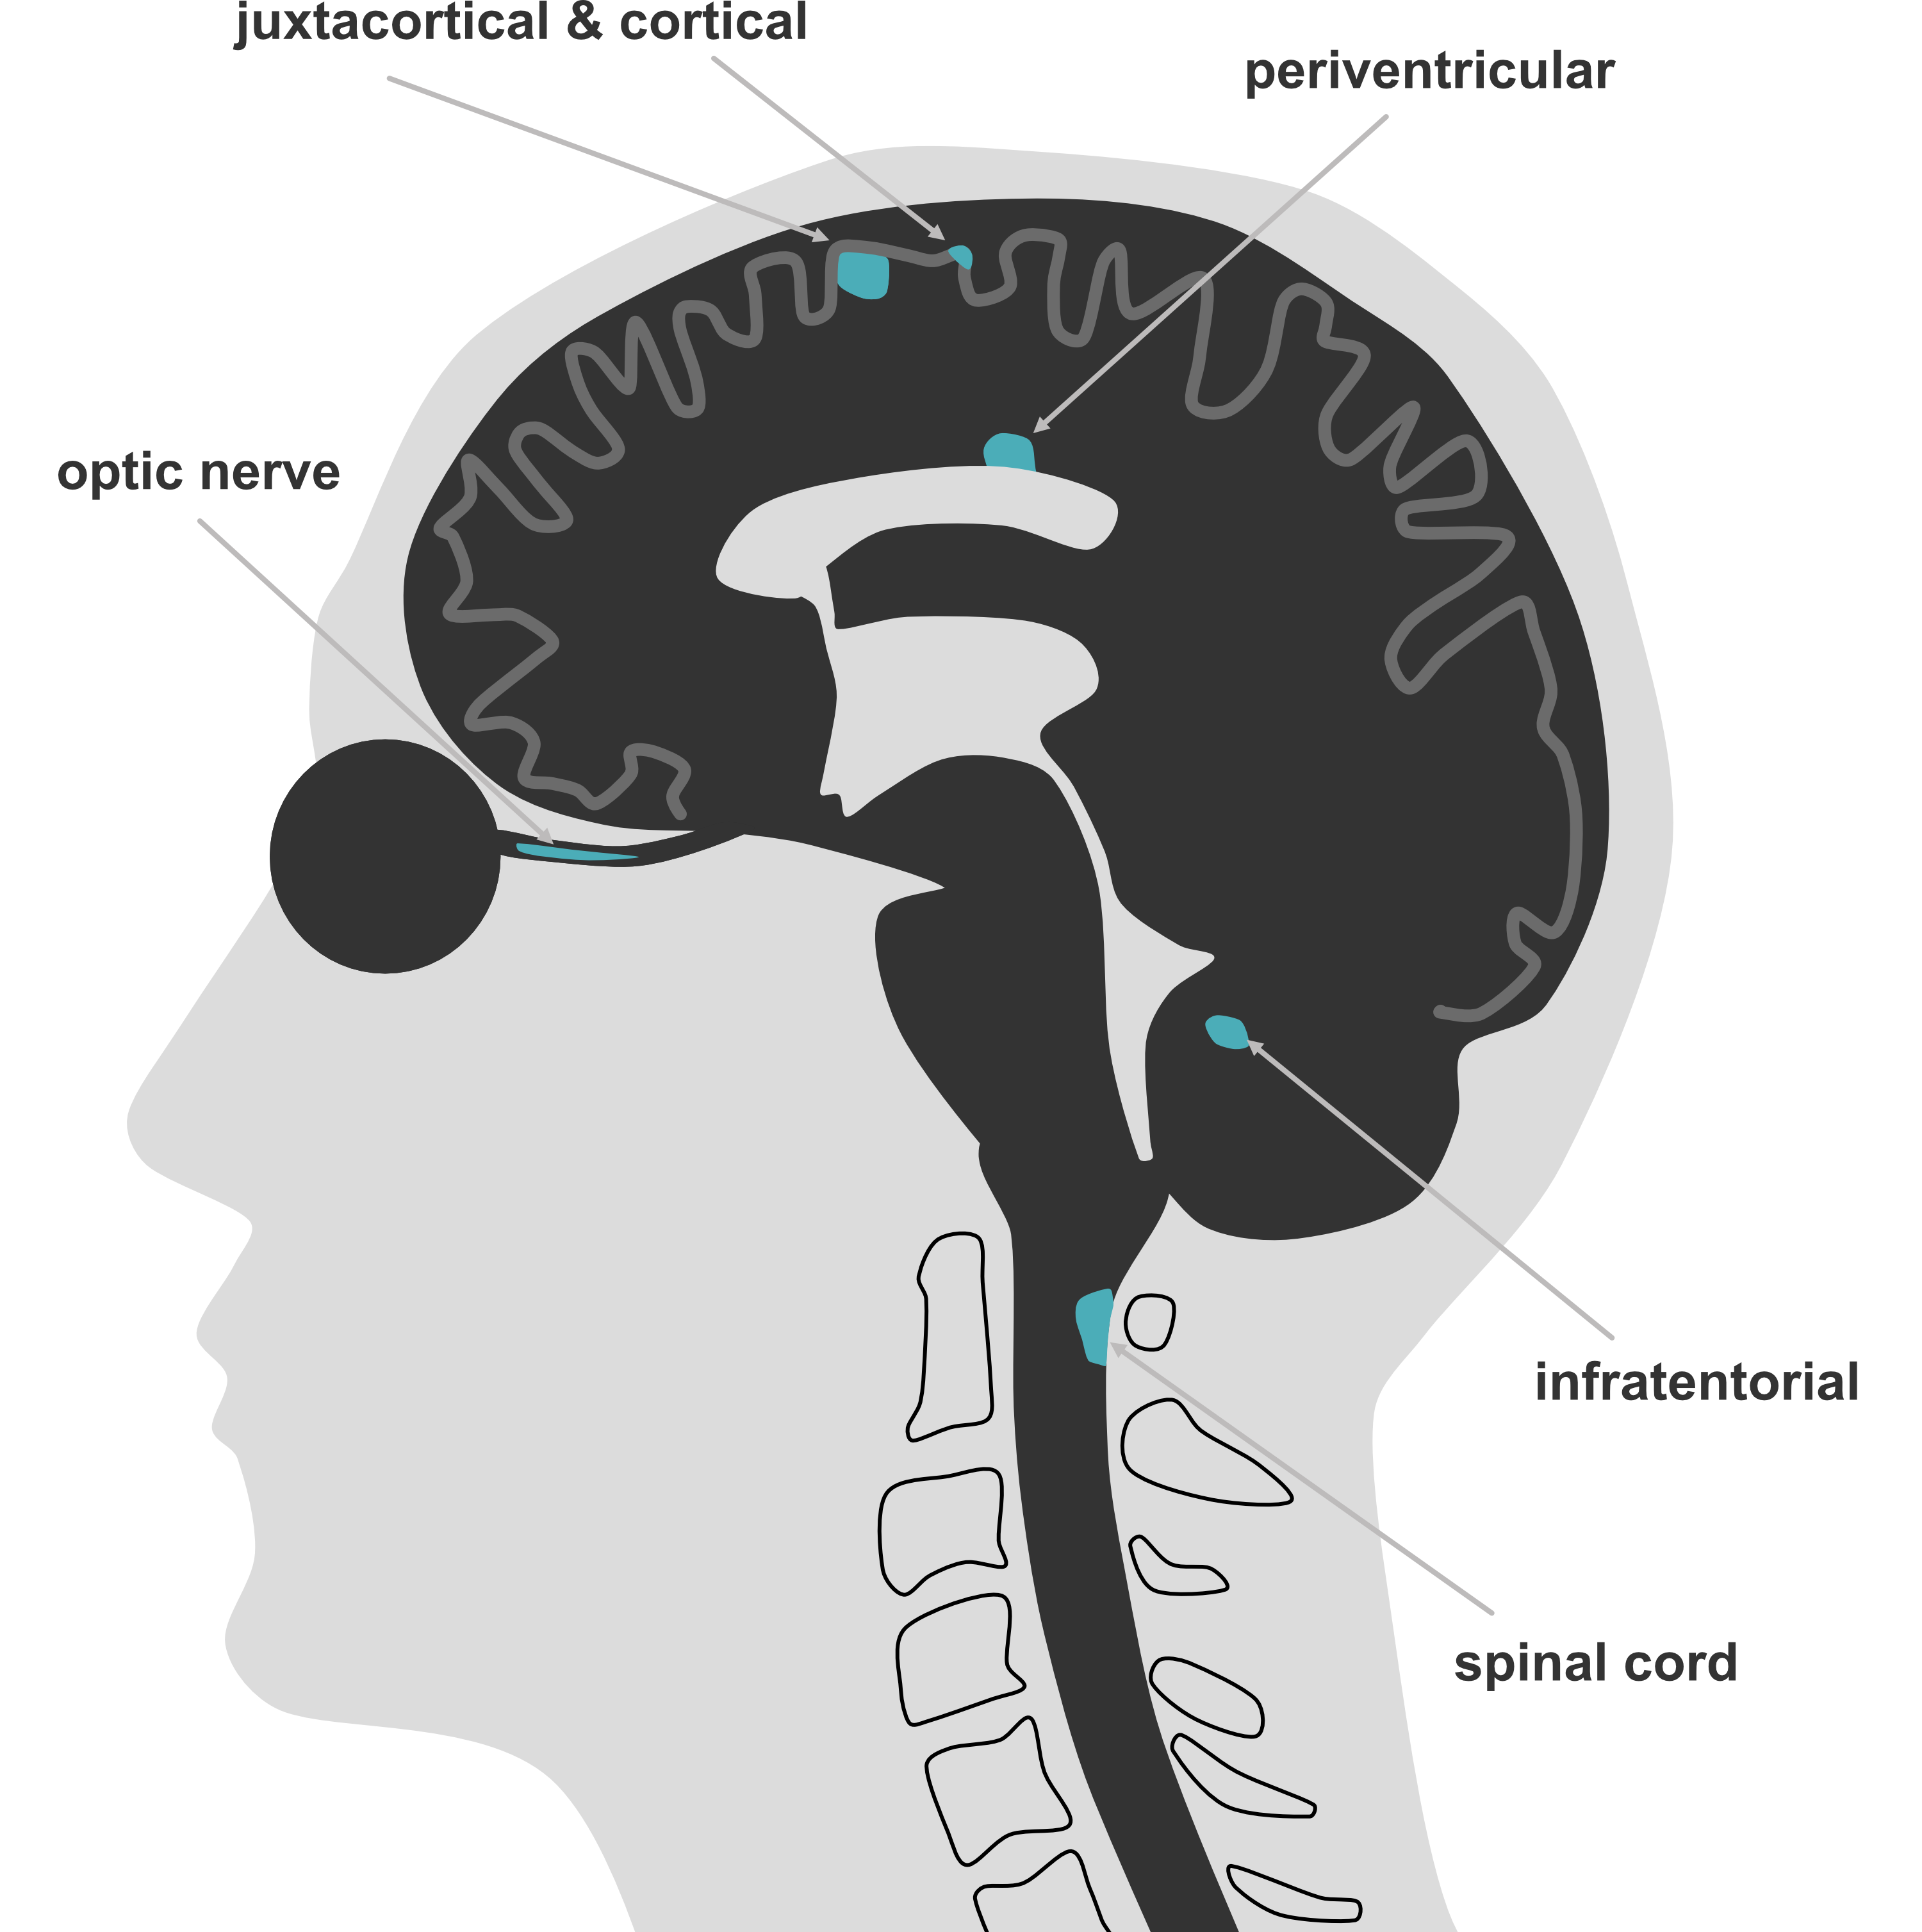
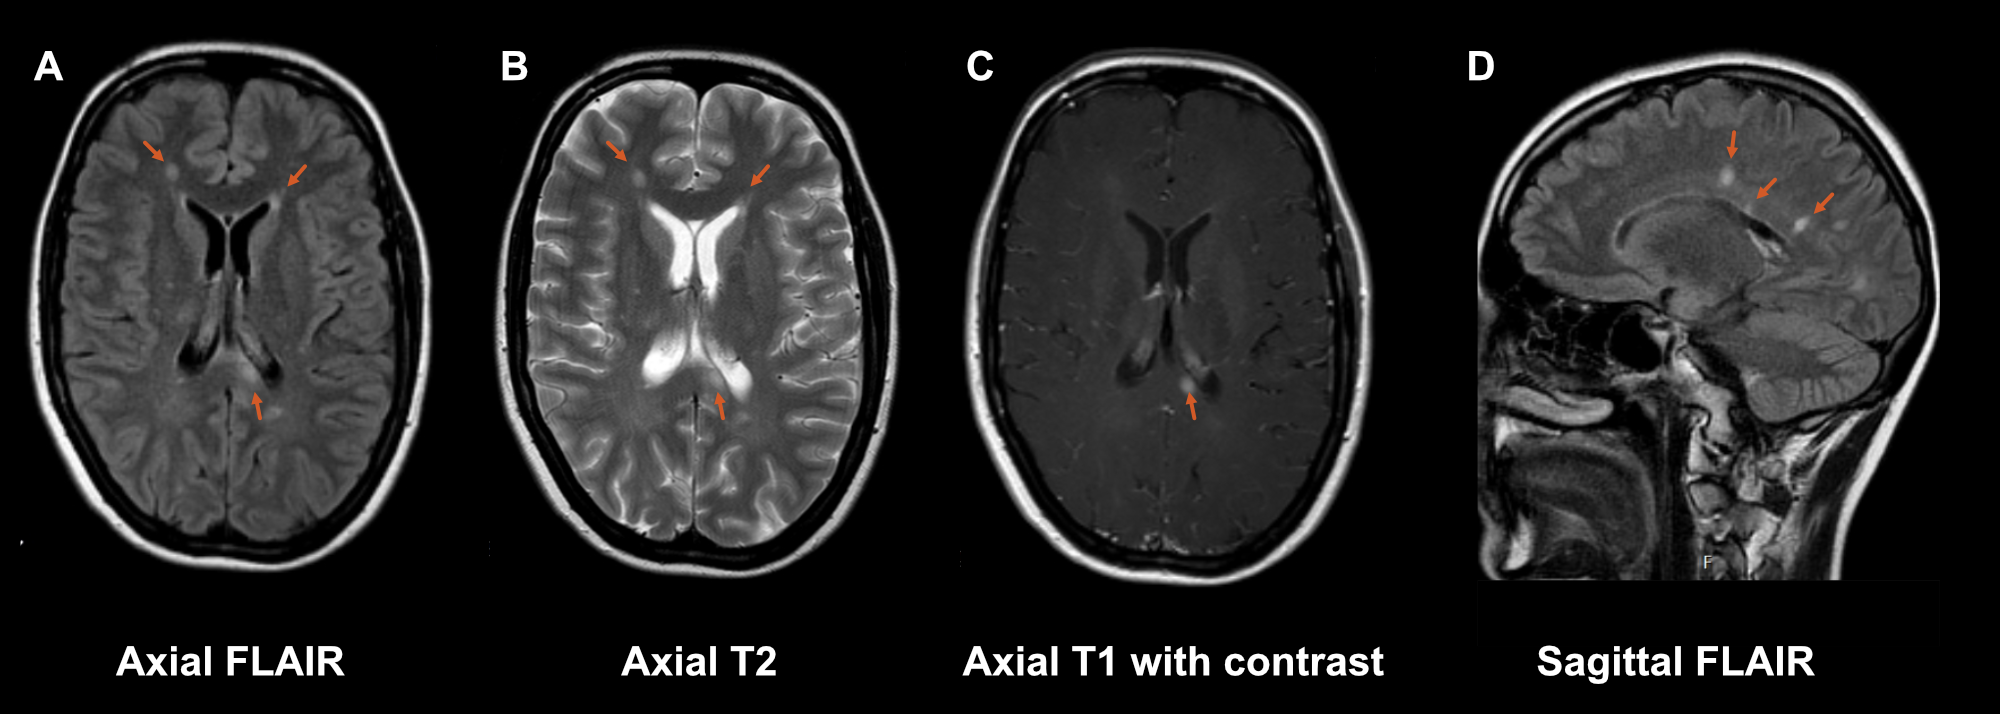
When a patient presents with (an episode of) neurological deficits fitting a pattern consistent with the central nervous system, demyelination can be in the differential diagnosis. A first episode in a demyelination context is called a clinically isolated syndrome (CIS). In that case, magnetic resonance imaging (MRI) is the cornerstone instrument in the diagnostic workup. Generally a diagnostic MRI scan for a multiple sclerosis suspicion consists of scanning the brain and spinal cord with administration of a contrast agent. The current diagnostic criteria are the 2024 McDonald criteria [18] (see table 1.1) where clinical information is combined with findings from MRI and (optionally) cerebrospinal fluid. The central concept of an MS diagnosis is proving dissemination in space (DIS; involvement of 2 or more CNS regions, see table 1.2) and time (DIT; evidence of an event at minimally two different time points). Additionally, other possible diagnoses need to be sufficiently excluded. With the 2017 and 2024 criteria, alternatives were introduced to replace proving DIS or DIT, to allow earlier diagnosis (see table 1.1). Now if DIS is proven (lesions in 2 or more CNS regions), DIT can be replaced by (i) CSF positivity (presence of oligoclonal bands or 𝜅 free light chains) or (ii) the presence of typical lesions in ≥4 of the 5 anatomical regions (see figure 1.3). If there is only one CNS site involved (DIS not proven), you need to have either DIT or CSF positivity combined with the presence of lesions with a central vein sign (CVS; at least 6, or when < 6 lesions, the number of lesions with a CVS should outnumber the CVS negative lesions) or at least one paramagnetic rim lesion (PRL) (for an example figure 1.4).
Table 1.1 - 2024 McDonald criteria for the diagnosis of multiple sclerosis
| Number of CNS sites involved2 | Relapse1 or progressive onset with: |
|---|---|
| 4 or 5 (DIS proven) | No further evidence needed |
| 2 or 3 (DIS proven) | Anyone of: DIT3, CSF4 or CVS5 |
| 1 | Combination of: When progression from onset (≥12 months): ≥2 spinal cord lesions and any one of: DIT3, CSF4, or CVS5 | |
| 0 | Not able to make diagnosis |
Adapted from Barkhof, 2025 [19].
1 Clinical attack defined as a clinical episode with patient-reported symptoms and objective findings reflecting a demyelinating event in the CNS, developing (sub)acutely, with a duration of >24h, with or without recovery, and in the absence of fever or infection. Objective clinical evidence defined as an abnormality on neurological examination, imaging, or neurophysiological testing that corresponds to the anatomical location suggested by the symptoms of the clinical episode.
2DIS (dissemination in space) by MRI: ≥ 1 symptomatic or asymptomatic lesion in ≥ 2 areas (cortical/juxtacortical, periventricular, infratentorial, optic nerve or spinal cord).
3DIT (dissemination in space) by MRI: new lesions on follow-up imaging or both gadolinium-enhancing and non-enhancing lesions on single MRI.
4CSF (cerebrospinal fluid) positivity: presence of unique oligoclonal bands or 𝜅 free light chains in CSF.
5CVS (central vein sign): presence of six or more lesions with CVS; if there are fewer than six lesions present, the number of CVS positive lesions should outnumber the CVS negative lesions.
6PRL (paramagnetic rim lesion): presence of one or more PRL.
1.2.1 MRI
On MRI we can assess if the lesions present fit a pattern consistent with MS and whether there are no red flags suggesting another diagnosis. Also, we can see whether the lesions occur in two or more CNS regions to meet the DIS criterion (table 1.2). In the diagnostic workup brain MRI is always included and spinal cord MRI is strongly recommended [20]. Spinal cord MRI is not only a supporting tool for showing DIS and DIT, but also an important aid in excluding alternative diagnoses. As cord lesions are more specific than brain lesions; there are no vascular white matter lesions that occur with normal ageing in the cord as opposed to the brain. It is recommended to image the cervical as well as thoracic spinal cord including the conus medullaris (lower end of the spinal cord). However, since lesions in the upper part of the spinal cord are more common in MS (also see figure 4.2 in chapter 4) and given that a cervical MRI generally covers spinal segments C1 to Th5, an often made compromise is to only preform a cervical MRI to reduce scanning time [20].
Supplement S1.1 gives additional background information on the MRI sequences used in MS imaging and recommended protocols.
Table 1.2 - Overview of anatomical regions, core sequences to image these regions and which radiological characteristics support MS or favor an alternative diagnosis [21].
| Anatomical region | Primary MRI sequence | Typical characteristics | Red flags (alternative diagnosis) |
|---|---|---|---|
| Periventricular | FLAIR | Perivenular distribution, abutting and perpendicular to the lateral ventricles | Lacunes/microbleeds (cerebrovascular disease, amyloid angiopathy). Periependymal/-aquaductal lesions (NMOSD). Extensive symmetric white matter lesions (leukodystrophy). |
| Juxtacortical/cortical | FLAIR, cortical: DIR / 3D-MPRAGE | Adjacent to or within cortex | Lacunes/microbleeds/cortical siderosis (cerebrovascular disease, amyloid angiopathy). Cortical diffusion restriction (acute cortical infarct). Diffuse larger lesion with ill-defined margins (PML). |
| Infratentorial | FLAIR | Brainstem, cerebellar/cerebral peduncles and cerebellar hemispheres, adjacent to cisterns / fourth ventricle floor, pons surface/pontine trigeminal root entry zone, paramedian medulla oblongata. | Lacunes/microbleeds/cortical siderosis/symmetric lesions in the pons (cerebrovascular disease, amyloid angiopathy). Periaqueductal, area postrema lesions or medullary lesions continuing in the cord (NMOSD). |
| Spinal cord | ≥2 sagittal sequences incl. T2, STIR, PD, PSIR or 3D T1-weighted MPRAGE | < 3 spinal levels; mostly small, peripheral, located in dorsal and lateral columns | Longitudinally extensive and/or most of cord involved in axial plane (NMOSD), only anterior localization (ischemic), leptomeningeal/root enhancement (sarcoidosis) |
| Optic nerve | Coronal 2D STIR, axial and coronal post-contrast fat-suppressed T1 | Unilateral short-length lesion | Long-length/posterior-chiasmal lesions (NMOSD) |
1.2.2 Biomarkers in diagnosis
Besides MRI, biomarkers in blood and cerebrospinal fluid can aid in making an MS diagnosis more likely and alternative diagnoses less likely.
To support the diagnosis unique oligoclonal bands (OCB) and 𝜅 free light chains in CSF can be used. Unique oligoclonal bands refer to bands of immunoglobulins that are only found in CSF and not in serum and are a marker of a humoral immune response within the CNS. OCBs are present in approximately 85% - 98% of MS patients [22–24], but are not exclusive to MS. For example, oligoclonal bands can be found in other neuroinfectious (e.g. neuroborreliosis, neurosyphilis) and neuroinflammatory disorders (e.g. systemic lupus erythematosus, neurosarcoidosis). Therefore, the role of OCB in MS diagnosis is mainly that an absence of unique OCB in CSF is a red flag and other diagnoses need to be considered. Where OCB are a qualitative measure of immunoglobulins, immunoglobulins can also be measured quantitatively. The amount of immunoglobulin isotype M and G in CSF can be compared against serum. In regard to the prognostic value of these markers, studies that investigated the association of OCBs/immunoglobulins and future disease activity have shown mixed results (more about this in chapter 5).
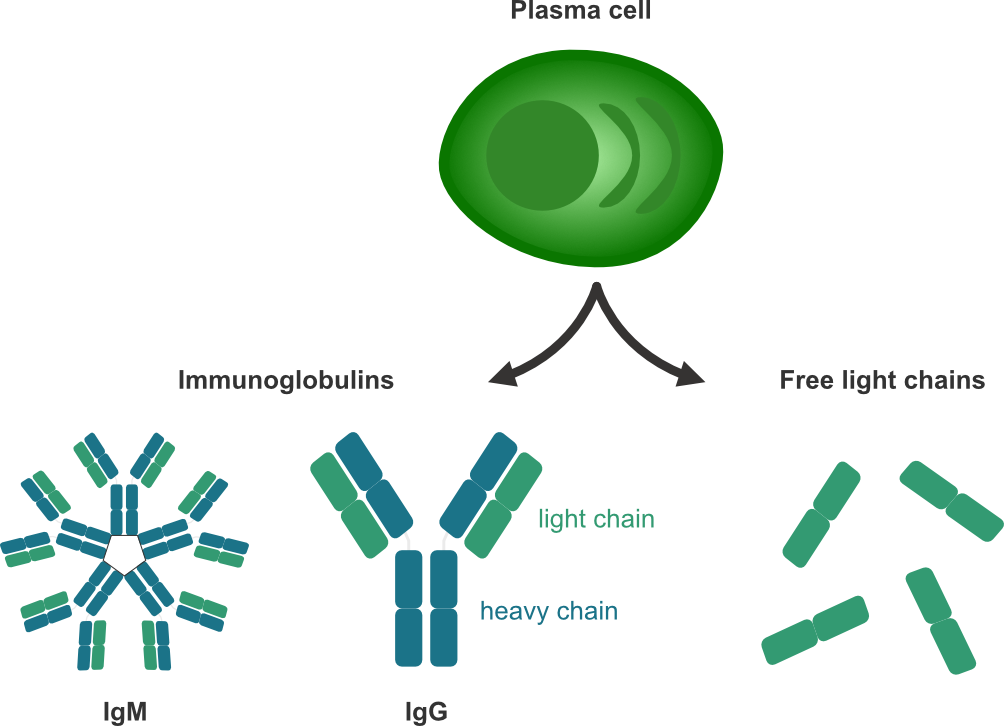
More recently, 𝜅 free light chains like OCB have established a place in the diagnostic criteria to replace DIT. Alongside intact immunoglobulins, which are composed of two heavy and two light chains, plasma cells secrete immunoglobulin free light chains (FLC) that can be detected in both CSF and blood (see figure 1.5). \(\kappa\)-FLC indices have been shown to be a good predictor of time to a second clinical attack / short-term disease progression [25–28].
Other markers used/studied in the context of disease monitoring and/or prognosis, are discussed in 1.3.3.
1.2.3 Evoked potentials
In an evoked potentials (EP) study, electrical activity in the brain is measured in response to stimulation of sight (visually EP [VEP]), sound (brainstem auditory EP [BAEP]), or touch (somatosensory EP [SSEP]). The motor response after magnetic stimulation of the motor cortex can be measured as well (motor evoked potentials [MEP]). Before the rise of MRI in the MS diagnostic workup these investigations were used in detecting possible (clinical manifest or subclinical) lesions causing conduction delays in these selected tracts of the CNS [29]. However, EP does not really tell something about the aetiology of the conduction abnormality. Currently, in clinical practice, EP studies are seldom used anymore as a diagnostic instrument in MS, but for example VEP is still used sometimes to support optic nerve involvement [24].
1.3 Treatment and follow-up
After diagnosis the initial treatment regimen will be determined. In the past 20 years there has been enormous progress in regard to disease-modifying treatment (DMT) in MS. Where it started with the first drug in 1993 (interferon beta 1b), there are now more than fifteen MS drugs on the market (all registered for RRMS and one for PPMS). The available therapies can be categorized by mechanism of action, degree of efficacy and mode of administration (oral, injection, infusion). Regarding degree of efficacy MS literature often speaks of low/moderate- and high-efficacy DMTs. This classification is based on the relapse reduction achieved in clinical studies, where low-efficacy is defined as around 30% relapse reduction (compared to placebo) versus more than 50% for high-efficacy [30]. It is important to note that all clinical trials of these DMTs included clinical and brain MRI outcomes, but no spinal cord outcomes, resulting in limited knowledge on the effect of DMTs on the formation spinal cord lesions.
In the choice of a therapy two approaches exist: One is an escalation approach, which is focused on safety, where a lower efficacy but also lower risk DMT is started and only when it inhibits disease activity insufficiently, it is later escalated to a higher efficacy DMT. The other approach, induction, focuses on an early and more aggressive intervention (i.e. high-efficacy DMTs) with the goal to prevent accumulation of irreversible damage in the CNS, especially in patients with negative prognostic factors (see table 1.3). Subsequently, patient characteristics/preferences will influence the choice of DMT (e.g. with regard to possible side-effects, mode of administration of the DMT) [30].
Additionally, in acute relapses with disabling symptoms high-dose intravenous corticosteroids are used for three to five days and sometimes plasmapheresis to try to reduce the acute inflammation.
Table 1.3 - Overview of important poor prognostic factors [31]
| Demographic / Environmental |
|---|
| Older age* |
| Male sex |
| Smoking |
| Low vitamin D |
| Obesity |
| Clinical |
| PPMS subtype |
| High relapse rate |
| Shorter interval 1st and 2nd relapse |
| Brainstem / cerebellar / spinal cord onset |
| Poor recovery first relapse |
| Higher EDSS at diagnosis |
| MRI |
| High lesion load (lesion count / volume) |
| Presence of gadolinium-enhancing lesions |
| Presence of spinal cord / infratentorial lesions |
| Brain atrophy |
| Biomarkers |
| Presence of oligoclonal bands in CSF |
| High levels of neurofilament light chain, \(\kappa\) free light chain, glial fibrillary acidic protein, chitinase |
* Patients presenting at an older age develop disability more rapidly compared with those diagnosed at a younger age. But younger patients have longer to live with the disease and are likely to develop disability milestones at an earlier age.
1.3.1 Follow-up
After the choice of therapy, the patient will enter a follow-up regimen. Generally, before starting or switching therapy at least a brain MRI is performed as a baseline scan. Additionally, 3-6 months after initiating the treatment another brain MRI is usually obtained to avoid misinterpretation of lesions that developed before the onset of the effect of the DMT (which takes a few months depending on the DMT). Then, usually a yearly brain MRI is obtained as long as the patient is on a DMT and intervals are extended when the patient is clinically stable after the first few years of treatment. Depending on the DMT, additional safety monitoring can be necessary, requiring shorter intervals between brain MRIs (e.g. patients on natalizumab that are positive for the John Cunningham [JC] virus and at risk of a progressive multifocal leukoencephalopathy) [20].
1.3.2 Spinal cord disease monitoring
In the current consensus guidelines, spinal cord MRI is not routinely recommended to detect subclinical activity and is mostly only scanned at follow-up in case of cord-related symptoms, unexplained disability progression or when a switch of treatment is considered [20]. But it remains controversial whether (in certain cases) spinal cord MRI should be part of routine follow-up, since there is evidence that asymptomatic spinal cord lesions can occur independent from brain radiological activity [32–34]. For example, in a 7-year longitudinal follow-up study by Rotstein and colleagues (n=219, cord imaging available in 74% of cohort), they found that each year 7.8% to 12.4% of patients, who had MRI disease activity after baseline, were active solely based on spinal cord MRI [34]. In another study (n=230), looking at MRIs with new cord lesions, 31.2% of the new cord lesions were asymptomatic, and in 12.1% of cases with new cord lesions there was neither clinical activity nor brain radiological activity. This shows that asymptomatic cord lesions are not that rare and it is not insignificant since asymptomatic cord lesions are independently associated with more disability at follow-up [35]. However, given these numbers, just adding routine spinal cord imaging to the follow-up regimen of every MS patient would be inefficient. The addition of spinal cord coverage to the scanning protocol results in ~30 to 45 minutes of extra scanning time per scan, with consequently considerable costs and burden on the often scarce MRI scanning capacity in many centres. Ideally, subgroups can be identified that are prone to more spinal cord involvement and who would benefit from routine spinal imaging. However, currently our understanding of factors contributing to spinal cord involvement in MS patients is limited.
Spinal cord MRI is also more challenging than brain MRI because of the small diameter and mobility of the cord. Additionally, in the spinal cord area there is affected more by physiological movement (swallowing, cardiac and respiratory action, CSF flow). The result is that spinal cord MRI images are more likely to suffer from artefacts, which in turn affects the sensitivity for lesions. This is a reason why multiple sequences with different contrasts (see supplement spinal cord MRI protocol) are required and preferably in multiple planes (i.e. sagittal and axial). This contributes to the considerable acquisition time needed to add spinal cord coverage to an MRI protocol. With the developments in the MRI field over the past years (e.g., parallel imaging, improved coils, motion correction techniques), it has already been possible to create more robust and time-efficient spinal cord protocols. If this keeps improving, this will probably also lower the threshold for adding cord imaging at follow-up in the future [36].
1.3.3 Other markers in disease monitoring
The growing recognition of the insidious neurodegenerative/compartmentalized inflammation component of MS, apart from the acute focal inflammatory bouts, lead to the search for other biomarkers more suitable than regular anatomical MRI for monitoring these gradual progressive changes. For example in PPMS, where the neurodegeneration is more prominent than the acute inflammation, there is a need for alternative markers than T2 lesion count/volume on MRI in disease monitoring. Below, a few important well-studied markers are discussed.
Using MRI, adapting specific sequences or advanced techniques, there are some markers that tell us something about neurodegeneration and compartmentalized inflammation. Most researched are volumetric measures (whole brain, grey/white matter and spinal cord atrophy), paramagnetic rims and slowly expanding lesions (some other techniques are discussed in chapter 1):
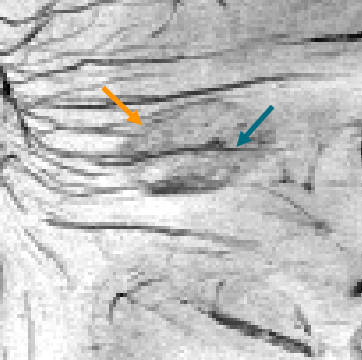
Slowly expanding lesions / paramagnetic rims
In chronic active lesions there is a rim of activated microglia/macrophages causing iron accumulation at the lesion’s edge. This paramagnetic rim can be visualized at pathological study, but more recently also in vivo with susceptibility-weighted MRI (a sequence enhancing the local disturbances to the magnetic field by (para)magnetic substances like iron). In turn, this continuous inflammation at the lesion’s margin leads to smouldering demyelination and causes slow expansion of the lesion over time. These “slowly expanding lesions” (SELs) are reported to be present in ~52% of MS cases (~58% in PPMS)[37] and are a poor prognostic factor [38, 39].
Atrophy
When 3D MRI sequences are acquired it is possible to derive the volume of the brain (or specifically white and grey matter) and the spinal cord. This can be used as an indirect marker of atrophy. Volume loss on MRI is not only disease-related atrophy (volumes loss due to neurodegeneration / neuronal loss in MS) but also loss related to aging-related changes, lifestyle, comorbidities and physiological fluctuations (hydration state, time of day). Technical factors (in relation to image acquisition but also segmentation/post-processing) also lead to fluctuations in measurements. Lastly, a temporary increase in volume due to inflammation, which then decreases over time or with treatment, can cause a relative volume loss resulting in pseudo-atrophy. As a result of these confounding factors the implementation on clinical patient-level is challenging and currently atrophy is mostly only used as an outcome on a group level in research [40].
In addition to (advanced) MRI markers, several blood/CSF makers including neurofilament light chain and GFAP also show promising results as markers for neurodegeneration in MS.
Neurofilament light chain (Nfl) & glial fibrillary acidic protein (GFAP)
Nfl and GFAP are both cytoskeletal proteins, the first of neurons and the latter of astrocytes. Nfl correlates with lesions in brain and spinal cord but also with relapses, disability worsening and treatment response [41, 42]. GFAP, on the other hand correlates less with disease activity at that moment but better with short-term disability progression [43]. Combined with the fact that Nfl and GFAP have only moderate correlation with each other and different studies show they have better prognostic value when combined [44], this shows they contain complementary information. However, it is important to keep in mind that both Nfl and GFAP are not specific markers for MS and can also increase in other neurological disorders. A major advantage of Nfl and GFAP as a biomarker is that the serum levels closely resemble the CSF levels of these proteins and therefore no lumbar puncture at follow-up is necessary [45]. Now with all the accumulated evidence, Nfl is slowly starting to be used in clinical practice as a marker complementary to MRI. GFAP as a marker is relatively newer and more large studies are needed to establish its potential role in MS clinical care.
1.4 This thesis
Aim of this thesis
In this thesis we aim to explore the differences between spinal cord and brain lesions in MS, whether differences exist in the underlying immunological mechanisms, in the repair processes, in their spatial distribution and if the differences between these CNS regions result in variations in the response to disease-modifying treatment.
Outline of this thesis
In chapter 2 we start with an overview based on the literature to date on the factors contributing to the disparity that exists between the degree of spinal cord and brain involvement in MS. Advanced MRI techniques have aided in being able to learn more and more about MS pathophysiology in vivo. Additionally, ultra-high field MRI (i.e. MRI with magnetic field strengths beyond 3 tesla) made it possible to image (pathology in) the brain at higher resolutions and to visualize important pathophysiological aspects of MS lesions, like central veins and paramagnetic rims, much better than at lower field strengths. Chapter 3 gives an overview on how far we are with ultra-high field imaging of the spinal cord in MS and what it can (and can not) help us with in the future.
Due to the differences between brain and spinal cord involvement in MS as a result of anatomical, immunological and blood-brain/spinal cord barrier differences, I propose that effects seen, in the currently available MS drug trials, on the included clinical and brain MRI outcomes, can probably not simply be extrapolated to the spinal cord. In chapters 4 and 5 two retrospective studies try to gain an impression on whether important differences exist in the protective effect of high-efficacy DMTs with regard to spinal cord lesions compared to the brain.
A possible disparity of the effect of DMTs on spinal cord versus brain, would provide an additional argument for routine follow-up with spinal cord imaging, but just adding spinal cord coverage to the brain imaging follow-up would be inefficient and have a low yield. Therefore, ideally, prognostic markers can be identified to find subgroups of MS patients more prone to future spinal cord disease activity, who would benefit from routine spinal cord MRI follow-up. Chapter 6 explores whether immunoglobulins in CSF can be of prognostic value in regard to cord lesions.
The retrospective studies conducted for this thesis, led to the design and start of the prospective longitudinal observational study described in chapter 7. The retrospective studies can’t really tell us something about silent radiological activity in the spinal cord, since that in clinical practice the cord is generally only scanned when there are new symptoms or unexplained progression. In the prospective study, the patients will be scanned routinely giving us insight into the incidence of asymptomatic cord lesions in patients commencing treatment and possible markers for a higher risk of spinal cord involvement.
Supplements
S1 Short overview of frequently used MRI sequences in MS
MRI brain protocol
The protocol as recommended in the 2021 international consensus guidelines [20]
Axial T2-weighted images (figure S1.1 B); MS lesions are best seen as hyperintense lesions on T2-weighted sequences. When the cerebrospinal fluid is also suppressed with an additional inversion recovery pulse, this is called the fluid-attenuated inversion recovery (FLAIR) sequence, contrast between white matter and lesions is even better. However, for the infratentorial region, the regular T2-weighted images have better sensitivity for lesions.
3D fluid-attenuated inversion recovery (FLAIR, figure S1.1 A); like discussed above FLAIR is the main sequence for detecting MS lesions. Preferably this is acquired in a 3D volume instead of in 2D slices. With a 3D volume you can reconstruct the images in every desirable plane (axial, coronal, sagittal and even oblique reconstructions).
Axial post-contrast T1-weighted (figure S1.1 C); in a diagnostic protocol a T1-weighted sequence after administration of a gadolinium contrast agent is added to differentiate between old and new lesions (and prove dissemination in time). Contrast agent has the biggest impact on T1 relaxation and not so much on T2 relaxation. Therefore, a T1-weighted sequence is used to visualize contrast-enhancing lesions. At follow-up post-contrast sequences are no longer necessary as one can compare the T2/FLAIR sequences with earlier scans.
Spinal cord MRI protocol
The 2021 international consensus guidelines [20] recommends at least two of:
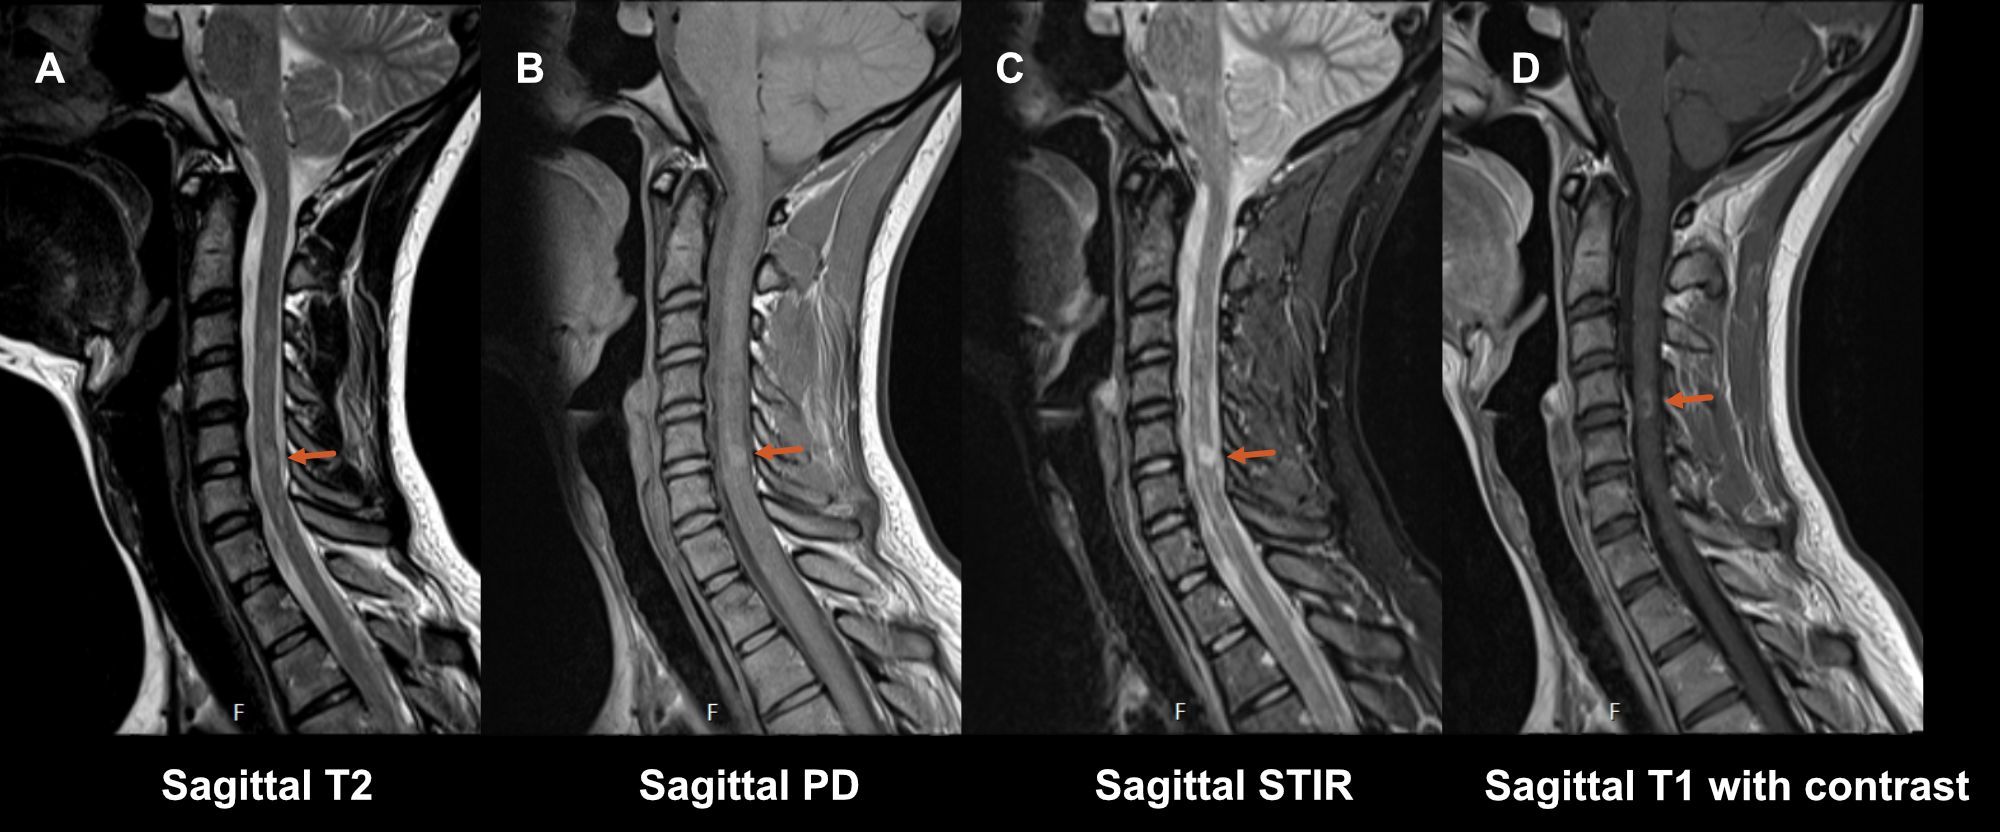
Sagittal T2-weighted sequence (figure S1.2 A) as a good anatomical sequence is the starting point in detecting hyperintense T2 abnormalities in the cord, however, its sensitivity for MS lesions is limited. Also, in spinal cord imaging artifacts are a more common problem than in brain imaging due to a lot of physiological movement in the region (breathing, cardiac action, swallowing). This is why at least a second confirmatory sagittal sequence is required:
- Sagittal short tau inversion recovery sequence (STIR) (figure S1.2 C) is a T2-weighted sequence with an inversion pulse to suppress the signal from fat. This sequence offers better contrast between lesions and white/grey matter in the cord, and therefore has a higher sensitivity, but has a lower resolution and is more prone to artifacts than the regular T2-weighted sequence.
OR
- Sagittal proton density-weighted sequence (PD) (figure S1.2 B). Here, the cord is the same intensity (isointense) to the cerebrospinal fluid. This makes it less useful for anatomical assessment of the cord, but it aids in the identification of increases in signal due to lesions within the spinal cord and is particularly useful for visualizing more diffuse lesions [46].
Sagittal post-contrast T1-weighted (figure S1.2 D); like for the brain, in a diagnostic protocol, a T1-weighted sequence after administration of a gadolinium contrast agent is added to differentiate between old and new lesions when no earlier scan is available.
Axial T2 images is an optional addition. It significantly lengthens the time of the protocol, but it results in higher sensitivity, makes it easier to characterize lesions and to make the distinction between artefacts/lesions [47].