Primary analysis

Figure 4.5: Propensity score matching of treated and control groups
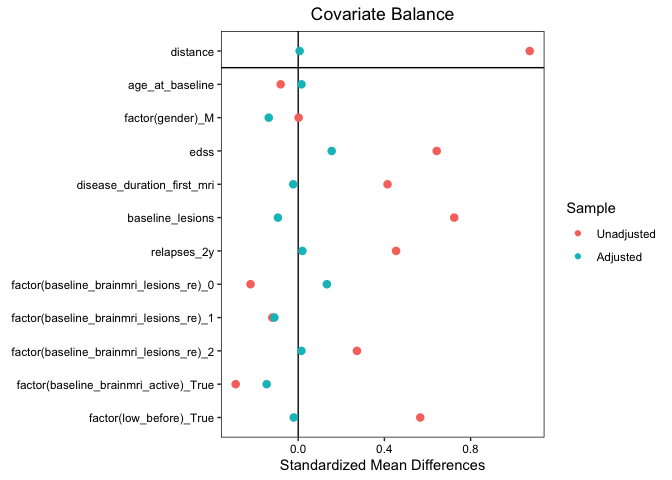
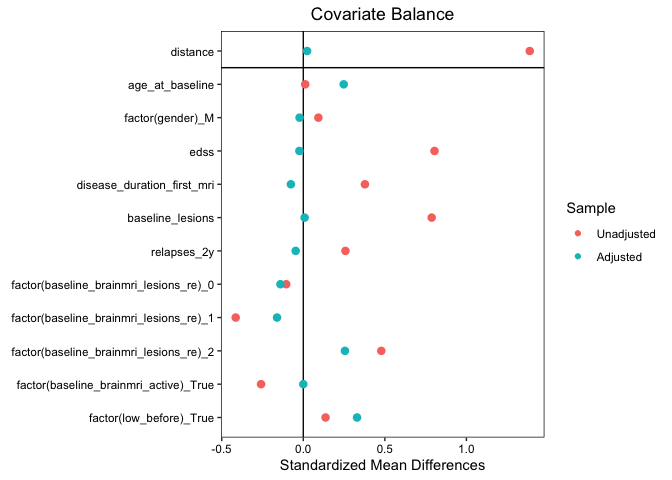
Figure 4.6: Covariate balance before and after matching
Kreiter, D., Spee, R., Merry, A., Hupperts, R., & Gerlach, O. (2023). Effect of disease-modifying treatment on spinal cord lesion formation in multiple sclerosis: A retrospective observational study. Multiple Sclerosis and Related Disorders, 79, 104994.
Background Spinal cord lesions in multiple sclerosis (MS) are an important contributor to disability. Knowledge on the effect of disease-modifying treatment (DMT) on spinal cord lesion formation in MS is sparse, as spinal cord outcome measures are seldom included in MS treatment trials. We aim to investigate whether intermediate- or high-efficacy DMTs (i/hDMT) can reduce spinal lesion formation, compared with low-efficacy DMTs (lDMT) and/or no treatment.
Methods In this retrospective observational study, we identified relapse-onset MS patients, from a tertiary MS center, of which spinal cord MRI data was available. Patients with at least two spinal MRIs (interval >3 months and <10 years) were included. The i/hDMT-group was defined as patients whom were treated with i/hDMTs during ≥90% of spinal MRI follow-up time. Patients receiving lDMT and/or no treatment ≥90% of follow-up duration, served as controls. In a secondary analysis, only patients using lDMT for ≥90% of follow-up were considered controls. To minimize confounding by severity, patients were matched using propensity-scores. Cox proportional hazards models were used to estimate the risk of new spinal lesions.
Results 323 patients had ≥2 spinal cord MRIs. 49 satisfied i/hDMT and 168 control group criteria. 34 i/hDMT patients were matched to 83 controls. Patients in the i/hDMT-group were significantly less likely to develop new cord lesions at follow-up (HR 0.29 [0.12-0.75], p=0.01). When the i/hDMT-group was matched to only controls using lDMT ≥90% of follow-up time (n=17 and n=25, respectively), there was no statistically significant difference (HR 1.01 [0.19-5.24], p=0.99).
Conclusion Treatment with intermediate- or high-efficacy DMTs reduces the risk of new spinal cord lesions compared with matched patients receiving no treatment and/or lDMTs, but this could not be demonstrated when compared with a control group receiving lDMT ≥90% of follow-up time.
Multiple sclerosis (MS) is the most common demyelinating disease of the central nervous system (CNS) and involves the brain as well as spinal cord. Spinal cord lesions are an important contributor to disability [211]. Approximately 80% of MS patients develop spinal cord lesions[50, 51], with one out of three patients initially presenting with symptoms fitting a spinal cord syndrome [91, 212].
In the diagnosis of MS, spinal cord MRI has become a routine investigation, as it is part of the present diagnostic criteria [213]. It mostly aids in proving dissemination in space since a large part of patients, with an initial non-spinal presentation, have spinal cord lesions [54, 91, 214]. In addition to its role in diagnosis, the value of imaging the spinal cord in relation to prognosis is becoming increasingly apparent. Patients with cord lesions, even asymptomatic lesions, are at increased risk of secondary progression and cord lesions are associated with more disability accrual in the long term [211, 215]. Consequently, the presence of spinal cord lesions is a factor that is taken into account in treatment decisions.
In general, spinal cord MRI is not part of routine follow-up in MS and nor was this recommended in international guidelines. The yield of scanning the spinal cord, without the presence of new cord-related symptoms, was considered low because cord lesions are mostly symptomatic and it leads to a significant increase in acquisition time [214]. However, in the recent MAGNIMS–CMSC–NAIMS consensus recommendations [216], this has become more nuanced as there is evidence showing that approximately 10% of relapsing-remitting MS patients develop asymptomatic cord lesions in absence of radiological disease activity on brain MRI [33, 157, 190]. Therefore, the present consensus guideline states that spinal cord imaging has a place in monitoring in case of spinal relapse, but also when there is clinical disease progression not explained by brain MRI or when deciding on switching treatments [216]. However, current knowledge on the effect of treatment on cord pathology in MS is very limited.
Disease-modifying treatments (DMT) inhibit disease activity by targeting neuroinflammation, leading to a reduction in the formation of demyelinating plaques and decrease of relapses. A distinction is made between low- and high-efficacy DMTs, generally based on the degree of relapse reduction [217]. Only very few DMT trials included spinal cord imaging outcomes, therefore little is known about the effect of DMTs on spinal cord lesion formation. To our knowledge, the ARPEGGIO laquinimod trial was the only drug trial explicitly including new spinal cord lesions as an outcome measure. Here, laquinimod was compared to placebo in primary progressive MS patients and no protective effect in regard to cord lesion formation was found and also no reduction in the cord atrophy rate [131]. Observational studies investigating whether patients receiving certain DMTs reach ‘no evidence of disease activity’ (NEDA) did also perform spinal cord imaging at baseline and follow-up, but do not report to what degree there were new spinal cord lesions [154, 156, 218–222]. Lastly, there are a few other trials evaluating the treatment effect on cord atrophy including interferons [163, 164, 167], glatiramer acetate [165] and fingolimod [168]. None of the studies showed a convincing protective effect on cord atrophy.
Based on several observations it can be argued that findings from DMT studies for the brain should not just be extrapolated to the cord. Firstly, the cord is different from the brain not just anatomically (volume, white/grey matter organization, vascularization [61, 223]), but also in barrier functions (differences in function and composition of the blood-spinal cord barrier compared to blood-brain barrier [69, 71]) and possibly immunological characteristics (certain lymphocyte subsets and cytokine profiles influencing localization of inflammatory activity [74, 75]). Secondly, radiological studies show that brain and cord pathology progress independently [55, 56, 224]. This advocates inclusion of spinal cord outcome measures in DMT studies. So that this can, ultimately, aid us in treatment decisions in relapse-onset MS patients with more spinal cord predominant disease.
As an initial step, in the present retrospective observational study, we aim to investigate whether treatment with intermediate- or high-efficacy DMTs (i/hDMTs), in addition to their known inhibitory effect on cerebral radiological disease activity, can also reduce (the risk of) spinal lesion formation, compared with low-efficacy DMTs (lDMTs) and/or no treatment.
Data was retrospectively extracted from the electronic health records of all patients visiting the outpatient clinic at our tertiary MS center (Academic MS center Zuyderland, Sittard-Geleen, The Netherlands) between August 2007 and September 2022. Patients were eligible for inclusion when (i) diagnosed with a relapse-onset MS, (ii) availability (images) of at least one spinal cord and brain MRI (base cohort). Over the extensive timeframe of this retrospective study, MRI systems were upgraded (e.g. introduction of 3T magnets) and scanning protocols tweaked numerous times (e.g. in most early protocols a proton-density [PD] sequence was acquired in addition to T2, whereas at later scans this often was a short-tau inversion recovery sequence [STIR] and/or phase-sensitive inversion recovery [PSIR]). For spinal cord MRIs to be included, at least a sagittal T2 had to be available and one other sequence suitable for showing MS lesions (e.g. STIR/PD/PSIR, T2/T2* in axial direction). Since there is no evident difference in lesion detection between 1.5T and 3T MRI systems, scans preformed on either field strength were eligible [225, 226]. Patients who had ≥2 spinal cord MRIs, with a minimum interval of 3 months and maximum of 10 years between two subsequent MRIs, were included in the primary analysis (study cohort). An EDSS score within 3 months and brain MRI within 6 months of baseline spinal cord MRI needed to be available to be included in the primary analysis. Exclusion criteria were: (i) Use of DMTs during follow-up that were not registered in the Netherlands by September 2022, (ii) hematopoietic stem cell transplantation. If patients already used i/hDMTs for more than 3 months in the year before baseline they were excluded from analyses. The study was approved by the institutional research ethics committee (METCZ20210102). Informed consent was waived because of the retrospective nature of the study and the use of anonymized clinical data.
Collected clinical data consisted of age, sex, expanded disability status scale (EDSS) scores, diagnosis date, relapse dates, received treatments (name, start and end date) and cerebrospinal fluid (CSF; oligoclonal bands and IgG index) data if available. For every spinal cord MRI, the date, coverage (cervical, thoracic or both), whether contrast was applied, lesion count (continuous) and their location were registered. Data on brain MRI consisted of date, number of T2 lesions (categorical: 0-2/3-8/≥9, lesion count categories based on earlier studies and the grading system used in the MSBase [227, 228]) and if there were signs of disease activity (new T2 or T1 Gd+ lesions). Original radiological reports were leading in data entry. In case information was missing in the reports or if original reports were lost, raw images were assessed by the investigator (DK). Radiological data was added to database before treatment data was viewed and extracted from the patients’ health records. During data collection an automatic data quality control procedure was performed (see supplement 1). Flagged irregularities were checked and where applicable data entry errors were corrected.
A patient was assigned to the i/hDMT-group when within the timespan of two spinal cord MRIs an i/hDMT was initiated and the patient was treated with a i/hDMT during ≥90% within this time interval. Patients treated with low-efficacy DMTs and/or no DMTs ≥90% of the time interval served as controls. Since in most cases there is some time between the baseline spinal cord MRI and initiating the DMT, the 90% of follow-up cutoff was chosen instead of 100%. To assess the impact of the chosen cut-off, sensitivity analyses with ≥95% and ≥80% i/hDMT-usage were performed as well. As a secondary analysis only patients treated with lDMT for ≥90% of follow-up were used as the control group instead (i.e., excluding patients receiving no DMTs).
In this study alemtuzumab, cladribine, mitoxantrone, natalizumab, ocrelizumab, ofatumumab, rituximab, dimethylfumarate, fingolimod, ponesimod, ozanimod, siponimod were classified as i/hDMTs. Interferons (beta-1a, beta-1b, peginteferon), glatiramer acetate, teriflunomide, immunoglobulins were considered lDMTs [217, 229]. The assumed duration of treatment effect was based on values used in earlier studies and data on duration of biological effectiveness: 2 months for natalizumab [230]; 6 months for mitoxantrone, ocrelizumab, ofatumumab and rituximab [230, 231]; 5 years for alemtuzumab [230] and 96 weeks for cladribine [232]. For the other therapies, the treatment effect was assumed to last until the last dose.
The primary outcome (event) was new spinal cord lesions during follow-up on spinal cord MRI (new T2 or T1-Gd+ lesions compared to the preceding spinal cord MRI). Patients could have had repeated events during follow-up. Follow-up time was defined as the longest possible spinal cord MRI follow-up in which treatment-group cutoffs remained satisfied.
To minimize confounding by severity, patients were matched using propensity scores based on clinical (age, sex, disease duration, EDSS, number of relapses in past 2 years, use of low-efficacy DMTs before baseline) and radiological parameters (baseline number of brain and cord lesions, new T2/T1-Gd+ lesions on brain MRI). Nearest-neighbor matching with a 1:3 variable ratio (1:2 in secondary analysis), without replacement and caliper of 0.1 is performed using the MatchIt R-package [233]. The balance of baseline variables was assessed using the standardized mean difference (SMD). All analyses using matched data were weighted to take into account the variable matching ratio.
Cox proportional hazards models, also accounting for repeated events (i.e., multiple new cord lesions during follow-up), were used on matched data to estimate the risk ratio of new spinal lesions between treatment groups. Two-sided p-values <0.05 were considered statistically significant. All statistical analyses were done using R version 4.2.1.
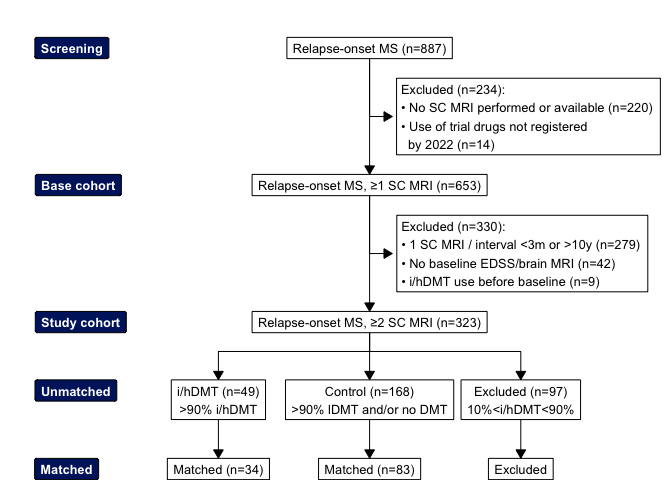
Figure 4.1: Flowchart of screening, inclusion and matching of study population
| Unmatched |
| Matched |
| ||
|---|---|---|---|---|---|---|
Characteristic | i/hDMT | Control | SMD2 | hDMT, N = 341 | Control, N = 831 | SMD2 |
Age | 37 (28, 45) | 36 (30, 45) | 0.08 | 37 (26, 45) | 34 (29, 41) | 0.02 |
Gender | ||||||
Female | 37 (76%) | 127 (76%) | 0.00 | 26 (76%) | 59 (71%) | 0.14 |
Male | 12 (24%) | 41 (24%) | 0.00 | 8 (24%) | 24 (29%) | 0.14 |
EDSS | 3.0 (2.0, 4.0) | 2.0 (1.0, 3.0) | 0.64 | 2.8 (2.0, 4.0) | 2.0 (1.5, 3.5) | 0.16 |
Relapses in past 2 years | 1 (1, 2) | 1 (0, 1) | 0.45 | 1 (1, 2) | 1 (0, 2) | 0.02 |
Baseline spinal cord lesions | 3.0 (1.0, 4.0) | 1.0 (0.0, 2.5) | 0.72 | 2.0 (1.0, 4.0) | 2.0 (1.0, 3.0) | 0.09 |
Baseline brain lesions | ||||||
0-2 | 7 (14%) | 37 (22%) | 0.22 | 5 (15%) | 13 (16%) | 0.13 |
3-8 | 19 (39%) | 75 (45%) | 0.12 | 14 (41%) | 38 (46%) | 0.11 |
9+ | 23 (47%) | 56 (33%) | 0.27 | 15 (44%) | 32 (39%) | 0.01 |
Disease activity baseline brain MRI | 33 (67%) | 136 (81%) | 0.29 | 23 (68%) | 65 (78%) | 0.15 |
Years disease duration | 8 (7) | 5 (8) | 0.41 | 6 (7) | 5 (8) | 0.02 |
lDMT in year before baseline3 | 17 (35%) | 13 (7.7%) | 0.57 | 6 (18%) | 9 (11%) | 0.02 |
Oligoclonal bands4 | ||||||
0 | 2 (7.1%) | 19 (17%) | 2 (9.1%) | 6 (12%) | ||
<10 | 14 (50%) | 54 (48%) | 10 (45%) | 28 (55%) | ||
≥10 | 12 (43%) | 39 (35%) | 10 (45%) | 17 (33%) | ||
(Missing) | 21 | 56 | 12 | 32 | ||
IgG index4 | 1.20 (0.48) | 1.09 (0.70) | 1.22 (0.48) | 1.16 (0.71) | ||
(Missing) | 7 | 48 | 7 | 23 | ||
1Median (Q1, Q3); n (%); Mean (SD) | ||||||
2Standardized mean difference | ||||||
3>3 months of lDMT usage in year before baseline | ||||||
4Not matched on this covariate | ||||||
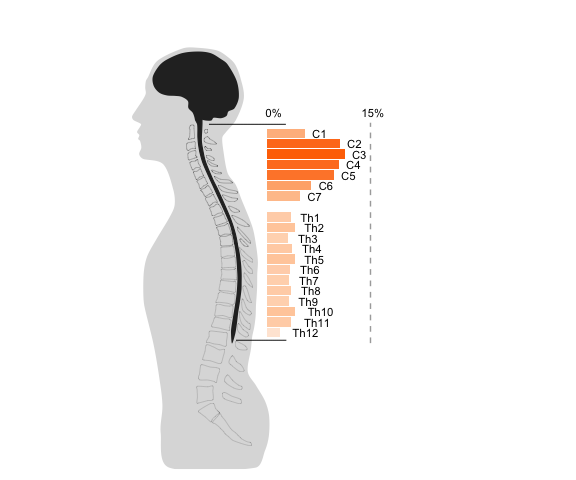
Figure 4.2: Distribution of lesions found on MRI along the spinal cord in base cohort, based on MRI data when cervical and spinal cord were scanned in the same session (data from 818 whole cord MRIs).
From the 887 screened patients, 653 relapse-onset MS patients had at least one spinal cord MRI (flow diagram of inclusion shown in figure 4.1). 68.3% of patients had lesions on their first spinal cord MRI. For characteristics of the base cohort see supplement 2. A total of 1410 lesions were identified on 1357 cervical and 855 thoracic spinal MRIs. The distribution of lesions across spinal levels is shown in figure 4.2. Most lesions were located on spinal levels C2-C5 (48%). When the cervical and thoracic cord were scanned within the same session (n=818), 19% of scans showed both cervical and thoracic lesions, 21% exclusively cervical cord lesions and 11% exclusively thoracic lesions.
From the base cohort, 323 patients had an additional spinal cord MRI >3 months and <10 years after baseline. After matching, the i/hDMT and control group consisted of 34 and 83 patients, respectively. Demographic and clinical characteristics of eligible patients before and after matching are shown in table 4.1. For detailed results from the matching procedure see supplement 3. For the primary analysis, the matched groups were well balanced on the measured characteristics at baseline (standardised mean differences <0.20). Mean (SD) spinal MRI follow-up time was 4.9 years (3.4), with a median (IQR) of 2 (1:3) follow-up MRIs, in the i/hDMT and 6.2 years (3.4), with a median of 2 (1:2) follow-up MRIs, in the control group. The DMTs used during follow-up in both groups are depicted in figure 4.3 (for DMT usage in the unmatched groups, see supplement 4). In the unmatched cohort, 11 of the i/hDMT-treated patients (22.4%) developed new cord lesions at follow up. For patients not treated with i/hDMTs this was 68 (40.5%). After matching, 6 (17.6%) i/hDMT-group patients developed a total of 7 new cord lesions at follow up. For the control group there were 38 patients (45.8%) with a total of 77 new lesions. When spinal cord MRI showed new cord lesions, in the i/hDMT-group 3/7 (42.9%) and 44/77 (57.1%) in the control group, had a clinical relapse within 3 months before the investigation. When there was a new cord lesion (and brain MRI data available at follow-up), in 4/5 (80%) cases in the i/hDMT-group, there were new brain lesions within the same timeframe and in 42/5 (85.7%) cases in the control group. During the complete follow-up in the matched cohort, 58.8% of i/hDMT patients and 81.9% of control patients had radiological activity on brain MRI.
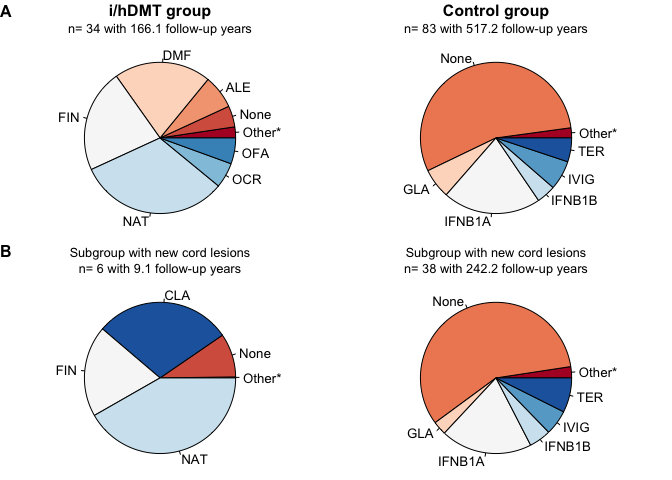
Figure 4.3: DMT usage during follow-up as proportion of follow-up time. (A) Matched patients i/hDMT and control group. (B) Patients from i/hDMT group with new lesions during follow-up. TER = teriflunomide, CLA = cladribine, NAT = natalizumab, ALE = alemtuzumab, FIN = fingolimod, MIT = mitoxantrone, OFA = ofatumumab, OCR = ocrelizumab, RTX = rituximab, DMF = dimethylfumarate, PON = ponesimod, ONA = ozanimod, SIP = siponimod, IVIG = immunoglobulins, IFNB1A = interferon beta 1a, IFNB1B = interferon beta 1b, PEGB1A = peginterferon beta 1a, GLA = glatiramer acetate . * = teriflunomide (0.11%), cladribine (1.6%), interferon beta 1b (0.56%), interferon beta 1a (0.09%) for the i/hDMT-group. In the control group: cladribine (0.21%), fingolimod (0.08%), dimethylfumarate (0.33%), ofatumumab (0.2%), ocrelizumab (0%), mitoxantrone (0.27%) . In the subgroup with new cord lesions from the i/hDMT-group group: interferon beta 1a (0.11%) and of the patients with lesions in the control group mitoxantrone (0.58%), dimethylfumarate (0.64%) .
Patients from the i/hDMT-group were significantly less likely to develop new spinal cord lesions at follow up (HR 0.29 [0.12-0.75], p=0.01) as shown in Figure 4.4 A. All new cord lesions in the i/hDMT group occurred within the first 3 years of follow-up. In the sensitivity analysis, using a 95% or 80% treatment class time cut-off instead of 90%, the differences were not statistically significant (resp. HR 0.72 [0.25-2.09], p=0.55 and HR 0.57 [0.27-1.2], p=0.14). For patient characteristics and cumulative hazard plots of the sensitivity analyses, see supplement 5
When only patients treated ≥90% with lDMTs of spinal follow-up were considered controls, 39 patients remained. After matching the i/hDMT and control group consisted of 17 and 25 patients, respectively. Here, matching was suboptimal (SMD >0.20 for ‘age’, ‘lDMT in year before baseline’ and ‘baseline brain MRI lesions’) as there were only few controls satisfying the ≥90% lDMT criterion (see supplement 3). No significant difference existed between groups (HR 1.01 [0.19-5.24], p=0.99) (Figure 4.4 B). For the characteristics and treatment data of patients included in the secondary analysis see supplement 6.
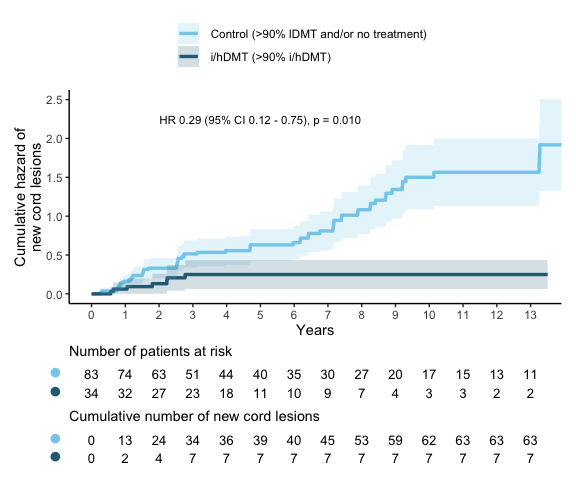
Figure 4.4: Cumulative hazard of new spinal cord lesions. A new spinal cord lesion is considered an event. A single patient can have multiple events.Primary analysis, with patients <10% i/hDMT usage during follow-up as control group. Follow-up until 13 years is shown, in the control group there were 8 patients with longer follow-up.
In the present study we aimed to investigate whether intermediate- and high-efficacy DMTs have a protective effect in spinal cord inflammatory activity in relapse-onset MS. The main finding is that patients on i/hDMTs had a reduced risk of new cord lesions at follow-up, when compared to a group that received lDMTs and/or no treatment for ≥90% of the follow-up period. This suggests that i/hDMTs also exert their effect on the spinal cord level. However, with the present data it was not possible to demonstrate whether i/hDMT treatment results in a larger reduction in the risk of new cord lesions when compared to lDMTs (excluding patients receiving no DMT).
In this study we show that i/hDMTs inhibit spinal cord lesion formation in relapse-onset MS. Some observational studies using NEDA as an outcome measure also included spinal cord MRI. Here, investigated i/hDMTs included natalizumab [218, 219], fingolimod [219, 221] and dimethylfumarate [156]. These studies all showed a positive effect on NEDA outcome measures, although they did not report how often new spinal cord lesions occurred, this would be of interest; In a study investigating NEDA in a large general MS cohort on varying DMTs, 8% to 12% each year had disease activity solely based on new spinal cord lesions on MRI (i.e., asymptomatic and no concomitant new lesions on brain MRI) [157].
While the sample size is not large enough to draw conclusions about individual DMTs, interestingly, when comparing the DMTs used at follow-up in the complete i/hDMT group to the subgroup from the i/hDMT group that developed new cord lesions (figure 3), also when the whole group pre-matching is considered, see supplement 6), none of the patients on anti-CD20 B cell depleting therapies (ocrelizumab and ofatumumab; no patients had used rituximab) developed new cord lesions. Also, there were no new lesions under alemtuzumab usage in this sample, which depletes CD52-positive B and T cells. Some pathological evidence exists that more severe spinal cord pathology (studied in a post-mortem SPMS patient sample) is correlated with the density of B cell, but not T cell, spinal meningeal infiltrates [122]. Therefore, as a direction for further research, it would be interesting to see whether a larger study can reproduce whether B-cell depleting therapy gives more protection against new cord lesions
Here, we only showed that i/hDMT usage results in risk reduction compared to no i/hDMTs (lDMTs or no treatment) for inhibiting cord lesion formation, but not that the effect of i/hDMTs is different to lDMTs on this outcome measure. The secondary analyses was aimed at seeing if a larger risk reduction could be shown when using i/hDMTs compared with lDMTs. However, with the secondary analysis control group criterion of ≥90% of follow-up time using lDMTs, too many controls were excluded for proper matching and thus no conclusions can be drawn from the secondary analysis. Lastly, while in the sensitivity analyses there also was a tendency towards a protective effect of i/hDMTs, here the differences were not statistically significant.
The strength of this study is that the use of propensity-score matching allowed us to create an i/hDMT- and control group with similar baseline characteristics from a real-world dataset. It is important to note that, while the matched groups are comparable on the measured variables, it is still possible that differences exist between the groups on unmeasured variables. Also, the retrospective design of this study has some drawbacks: Spinal cord MRIs were performed at the discretion of the clinician and in practice this is mostly in case of relapses or disability progression. Therefore, due to the selection of patients with ≥2 spinal cord MRIs, incidence of new cord lesions, in the i/hDMT as well as control groups, will probably be higher than when a general MS population would be scanned routinely at an interval in a prospective setting. Also, this makes that the present data can’t inform us on asymptomatic lesions. While only roughly half of patients had a relapse in the 3 months before a spinal cord MRI with a new lesion, this does not mean the lesion was asymptomatic, as the lesion could have developed earlier or there could have been disability progression independent of relapses. In the scenario that patients treated with i/hDMTs would have a higher probability of a new cord lesion being asymptomatic, this could have biased the results, leading to an underestimation of new spinal cord lesion in the i/hDMT group. However, there is currently hardly any supporting evidence that new spinal lesions under i/hDMT are indeed more often asymptomatic. Only in one study in patients switching from interferon-beta to fingolimod, 73% of new cord lesions were asymptomatic during the fingolimod phase versus 36% during interferon-beta usage [234]. However, inherent to the design (treatment switch) of that study, all patients had a longer disease duration when on fingolimod. Lastly, over the years MRI sequences and scanners have improved. This could have led to spinal cord scans giving the impression of new cord lesions, while in fact these already existed but weren’t detected due to the possible poorer image quality on earlier scans. To limit this, a maximal interval between subsequent spinal cord MRIs of 10 years was used, but will probably not have entirely mitigated it. Though, this would have led to an overestimation in both groups and therefore should not have biased the results. Lastly, it could occur that the same patient was scanned on different field strengths at follow-up. Given that the difference in lesion sensitivity between 1.5T and 3T (in contrast to the brain) seems limited for spinal cord MRI [225] and that no structural differences between groups are expected, this should not have influenced the results.
Thus, a future prospective follow-up study with routine spinal cord MRI would be of added value and can inform us on (i) asymptomatic lesion formation, (ii) how treatment affects the likelihood of a cord lesion being symptomatic and (iii) whether present results of the protective effect of i/hDMT treatment can be confirmed, while assuring constant scanning parameters. Also, there would be benefit of studying factors predicting a more spinal cord predominant disease course to see if these patients would gain from routine spinal cord MRI follow-up. Lastly, further studying the effect of individual DMTs on MS cord pathology can provide us with important knowledge for aiding treatment decisions in MS patients with cord involvement.
In conclusion, the current study gives an initial glimpse of the effect of intermediate- and high-efficacy DMTs on MS spinal cord disease activity, by showing that i/hDMTs significantly reduce the risk of new spinal cord lesions when compared to matched patients receiving no treatment and/or lDMTs. But, whether it results in a larger risk reduction than in lDMT usage, remains a subject for further study. Also, future research should confirm this in a prospective setting and MS treatment trials should more often include spinal cord radiological outcome measures to expand our knowledge on treatment effect on the spinal cord in MS.
Data quality control
Characteristics of base cohort
| Characteristic | N = 6531 |
|---|---|
| Gender | |
| F | 496 (76%) |
| M | 157 (24%) |
| Age at diagnosis | 34 (27, 42) |
| EDSS | 2.0 (1.5, 2.5) |
| (Missing) | 357 |
| Presenting syndrome | |
| Optic neuritis | 163 (25%) |
| Infratentorial | 126 (19%) |
| Spinal | 181 (28%) |
| Supratentorial / Other | 153 (23%) |
| (Missing) | 30 (4.6%) |
| Lesions on first cord MRI | 1.0 (0.0, 3.0) |
| Years from first clinical episode to cord MRI | 1 (0, 8) |
| Lesions on first brain MRI | |
| 0-2 | 126 (19%) |
| 3-8 | 266 (41%) |
| 9+ | 261 (40%) |
| Years follow-up time since first episode | 14 (8, 22) |
| Oligoclonal bands | |
| <10 | 191 (46%) |
| ≥10 | 180 (44%) |
| 0 | 40 (9.7%) |
| (Missing) | 242 |
| IgG index | 0.93 (0.71, 1.41) |
| (Missing) | 153 |
| 1 n (%); Median (Q1, Q3) | |
Matching
DMT usage in unmatched treatment groups
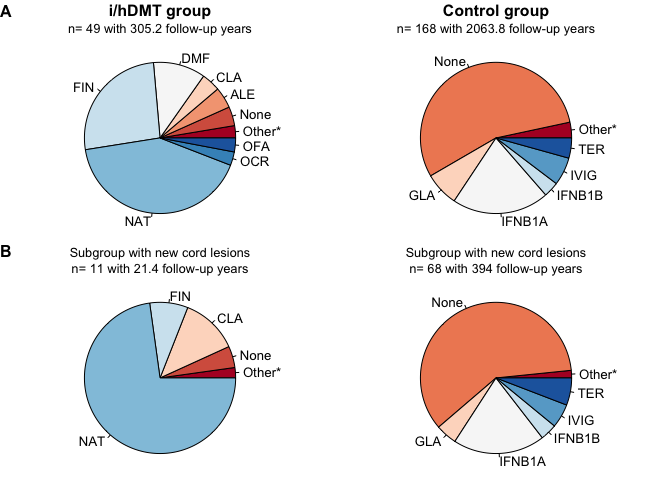
Figure 4.9: DMT usage during of treatment groups before matching, follow-up as proportion of follow-up time. (A) Matched patients i/hDMT and control group. (B) Patients from i/hDMT group with new lesions during follow-up. TER = teriflunomide, CLA = cladribine, NAT = natalizumab, ALE = alemtuzumab, FIN = fingolimod, MIT = mitoxantrone, OFA = ofatumumab, OCR = ocrelizumab, RTX = rituximab, DMF = dimethylfumarate, PON = ponesimod, ONA = ozanimod, SIP = siponimod, IVIG = immunoglobulins, IFNB1A = interferon beta 1a, IFNB1B = interferon beta 1b, PEGB1A = peginterferon beta 1a, GLA = glatiramer acetate . * = teriflunomide (0.08%), interferon beta 1a (0.12%), glatiramer acetate (0.27%), interferon beta 1b (0.3%), mitoxantrone (0.53%), immunoglobulins (0.02%) for the i/hDMT group. In the control group: natalizumab (0.04%), dimethylfumarate (0.37%), cladribine (0.51%), peginterferon beta 1a (0.29%), fingolimod (0.04%), ofatumumab (0.05%), ocrelizumab (0.14%), mitoxantrone (0.27%) . In the subgroup with new cord lesions from the i/hDMT group: interferon beta 1a (0.42%), glatiramer acetate (0.7%) and of the patients with lesions in the control group dimethylfumarate (0.46%), mitoxantrone (0.36%) .
Sensitivity analyses
| Unmatched |
| Matched |
| ||
|---|---|---|---|---|---|---|
Characteristic | i/hDMT | Control | SMD2 | hDMT, N = 431 | Control, N = 1161 | SMD2 |
Age | 36 (27, 44) | 36 (29, 45) | 0.13 | 37 (27, 45) | 35 (29, 42) | 0.06 |
Gender | ||||||
Female | 43 (73%) | 125 (76%) | 0.06 | 29 (67%) | 85 (73%) | 0.07 |
Male | 16 (27%) | 40 (24%) | 0.06 | 14 (33%) | 31 (27%) | 0.07 |
EDSS | 2.5 (2.0, 4.0) | 2.0 (1.0, 3.0) | 0.47 | 2.5 (2.0, 3.0) | 2.0 (1.5, 3.0) | 0.12 |
Relapses in past 2 years | 1 (1, 2) | 1 (0, 1) | 0.35 | 1 (1, 2) | 1 (0, 1) | 0.10 |
Baseline spinal cord lesions | 3.0 (1.0, 4.0) | 1.0 (0.0, 2.0) | 0.69 | 2.0 (1.0, 3.0) | 1.0 (1.0, 3.0) | 0.00 |
Baseline brain lesions | ||||||
0-2 | 14 (24%) | 36 (22%) | 0.04 | 11 (26%) | 33 (28%) | 0.05 |
3-8 | 22 (37%) | 71 (43%) | 0.12 | 17 (40%) | 46 (40%) | 0.01 |
9+ | 23 (39%) | 58 (35%) | 0.08 | 15 (35%) | 37 (32%) | 0.04 |
Disease activity baseline brain MRI | 43 (73%) | 134 (81%) | 0.19 | 34 (79%) | 89 (77%) | 0.07 |
Years disease duration | 7 (7) | 5 (8) | 0.29 | 5 (6) | 5 (7) | 0.01 |
lDMT in year before baseline | 16 (27%) | 12 (7.3%) | 0.45 | 5 (12%) | 12 (10%) | 0.09 |
Oligoclonal bands | ||||||
0 | 2 (5.4%) | 19 (17%) | 2 (6.7%) | 8 (11%) | ||
<10 | 18 (49%) | 57 (50%) | 14 (47%) | 39 (53%) | ||
≥10 | 17 (46%) | 38 (33%) | 14 (47%) | 26 (36%) | ||
(Missing) | 22 | 51 | 13 | 43 | ||
IgG index | 1.26 (0.50) | 1.11 (0.74) | 1.26 (0.53) | 1.14 (0.73) | ||
(Missing) | 10 | 47 | 7 | 38 | ||
1Median (Q1, Q3); n (%); Mean (SD) | ||||||
2Standardized mean difference | ||||||
| Unmatched |
| Matched |
| ||
|---|---|---|---|---|---|---|
Characteristic | i/hDMT | Control | SMD2 | hDMT, N = 201 | Control, N = 421 | SMD2 |
Age | 38 (27, 44) | 36 (30, 44) | 0.06 | 38 (24, 44) | 34 (27, 41) | 0.03 |
Gender | ||||||
Female | 21 (75%) | 131 (76%) | 0.03 | 14 (70%) | 32 (76%) | 0.12 |
Male | 7 (25%) | 41 (24%) | 0.03 | 6 (30%) | 10 (24%) | 0.12 |
EDSS | 3.0 (2.0, 4.0) | 2.0 (1.0, 3.0) | 0.82 | 3.0 (2.0, 4.0) | 2.5 (2.0, 3.0) | 0.02 |
Relapses in past 2 years | 2 (1, 3) | 1 (0, 1) | 0.65 | 1 (1, 3) | 1 (1, 2) | 0.04 |
Baseline spinal cord lesions | 2.0 (1.0, 4.0) | 1.0 (0.0, 3.0) | 0.52 | 2.0 (1.0, 3.5) | 1.0 (0.0, 3.0) | 0.28 |
Baseline brain lesions | ||||||
0-2 | 3 (11%) | 39 (23%) | 0.39 | 3 (15%) | 7 (17%) | 0.08 |
3-8 | 11 (39%) | 78 (45%) | 0.12 | 9 (45%) | 21 (50%) | 0.03 |
9+ | 14 (50%) | 55 (32%) | 0.36 | 8 (40%) | 14 (33%) | 0.02 |
Disease activity baseline brain MRI | 18 (64%) | 140 (81%) | 0.36 | 14 (70%) | 28 (67%) | 0.09 |
Years disease duration | 7.4 (6.6) | 4.4 (6.9) | 0.45 | 5.1 (6.2) | 4.2 (6.6) | 0.08 |
lDMT in year before baseline | 8 (29%) | 14 (8.1%) | 0.45 | 3 (15%) | 6 (14%) | 0.11 |
Oligoclonal bands | ||||||
0 | 2 (13%) | 19 (17%) | 2 (17%) | 5 (16%) | ||
<10 | 11 (69%) | 55 (48%) | 7 (58%) | 13 (41%) | ||
≥10 | 3 (19%) | 40 (35%) | 3 (25%) | 14 (44%) | ||
(Missing) | 12 | 58 | 8 | 10 | ||
IgG index | 1.15 (0.48) | 1.08 (0.65) | 1.17 (0.51) | 1.26 (0.66) | ||
(Missing) | 2 | 48 | 2 | 11 | ||
1Median (Q1, Q3); n (%); Mean (SD) | ||||||
2Standardized mean difference | ||||||
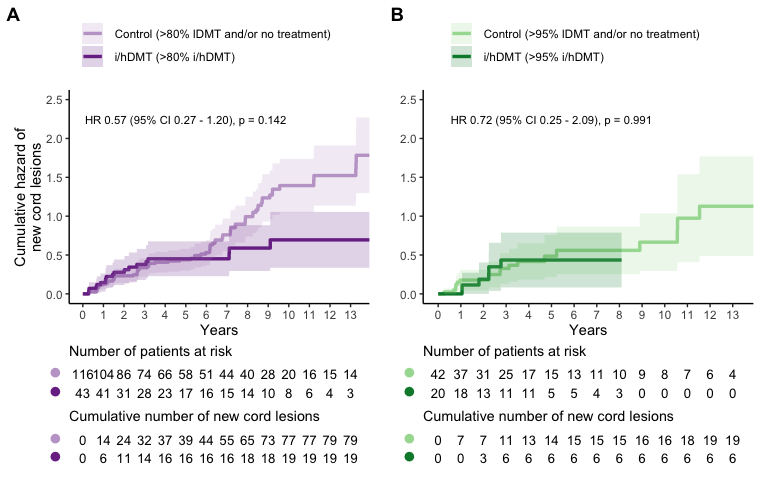
Figure 4.10: Cumulative hazard of new spinal cord lesions. A new spinal cord lesion is considered an event. A single patient can have multiple events. (A) Sensitivity analysis, with patients >80% i/hDMT during follow-up time as i/hDMT-group and >80% no and/or lDMT usage during follow-up as control group. (B) Sensitivity analysis, with patients >95% i/hDMT during follow-up time as i/hDMT-group and >95% no and/or lDMT usage during follow-up as control group. Follow-up until 13 years is shown, in the control groups there were some patients with longer follow-up, 10 and 4 for plots A and B respectively.
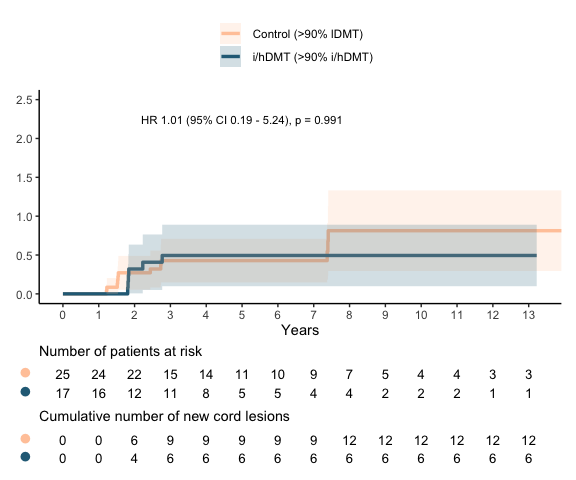
Figure 4.11: Cumulative hazard of new spinal cord lesions. A new spinal cord lesion is considered an event. A single patient can have multiple events. Secondary analysis, with patients >90% lDMT usage during follow-up as control group. Follow-up until 13 years is shown, in the control group there were 5 patients with longer follow-up
Secondary analysis patient characteristics
| Unmatched |
| Matched |
| ||
|---|---|---|---|---|---|---|
Characteristic | i/hDMT | Control | SMD2 | hDMT, N = 171 | Control, N = 251 | SMD2 |
Age | 37 (28, 45) | 36 (32, 44) | 0.01 | 42 (24, 47) | 35 (27, 40) | 0.25 |
Gender | ||||||
Female | 37 (76%) | 31 (79%) | 0.09 | 13 (76%) | 19 (76%) | 0.02 |
Male | 12 (24%) | 8 (21%) | 0.09 | 4 (24%) | 6 (24%) | 0.02 |
EDSS | 3.0 (2.0, 4.0) | 1.5 (1.0, 2.0) | 0.80 | 2.0 (2.0, 3.0) | 2.0 (1.0, 3.0) | 0.02 |
Relapses in past 2 years | 1 (1, 2) | 1 (1, 2) | 0.26 | 1 (1, 2) | 1 (1, 2) | 0.05 |
Baseline spinal cord lesions | 3.0 (1.0, 4.0) | 1.0 (0.0, 2.0) | 0.79 | 2.0 (1.0, 3.0) | 1.0 (0.0, 3.0) | 0.01 |
Baseline brain lesions | ||||||
0-2 | 7 (14%) | 7 (18%) | 0.10 | 2 (12%) | 4 (16%) | 0.14 |
3-8 | 19 (39%) | 23 (59%) | 0.41 | 9 (53%) | 16 (64%) | 0.16 |
9+ | 23 (47%) | 9 (23%) | 0.48 | 6 (35%) | 5 (20%) | 0.26 |
Disease activity baseline brain MRI | 33 (67%) | 31 (79%) | 0.26 | 14 (82%) | 21 (84%) | 0.00 |
Years disease duration | 7.5 (7.0) | 4.9 (5.2) | 0.38 | 3.9 (3.5) | 4.0 (4.1) | 0.08 |
lDMT in year before baseline | 17 (35%) | 11 (28%) | 0.14 | 6 (35%) | 5 (20%) | 0.33 |
Oligoclonal bands | ||||||
0 | 2 (7.1%) | 3 (12%) | 0 (0%) | 2 (12%) | ||
<10 | 14 (50%) | 11 (44%) | 6 (55%) | 6 (35%) | ||
≥10 | 12 (43%) | 11 (44%) | 5 (45%) | 9 (53%) | ||
(Missing) | 21 | 14 | 6 | 8 | ||
IgG index | 1.20 (0.48) | 1.04 (0.52) | 1.14 (0.55) | 1.09 (0.60) | ||
(Missing) | 7 | 8 | 3 | 5 | ||
1Median (Q1, Q3); n (%); Mean (SD) | ||||||
2Standardized mean difference | ||||||
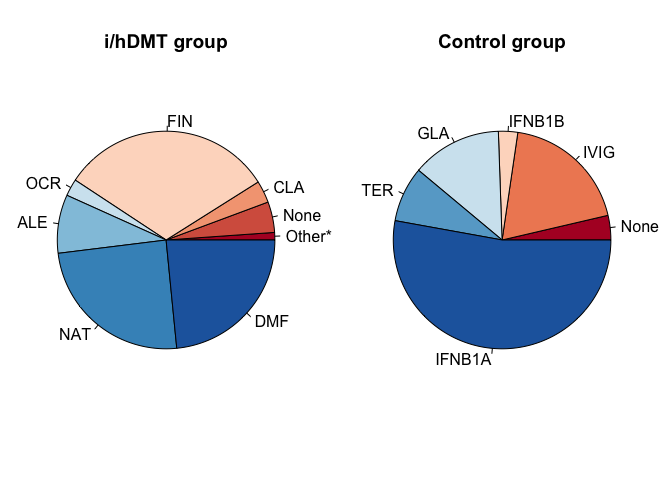
Figure 4.12: DMT usage during follow-up as proportion of follow-up time (secondary analysis). TER = teriflunomide, CLA = cladribine, NAT = natalizumab, ALE = alemtuzumab, FIN = fingolimod, MIT = mitoxantrone, OFA = ofatumumab, OCR = ocrelizumab, RTX = rituximab, DMF = dimethylfumarate, PON = ponesimod, ONA = ozanimod, SIP = siponimod, IVIG = immunoglobulins, IFNB1A = interferon beta 1a, IFNB1B = interferon beta 1b, PEGB1A = peginterferon beta 1a, GLA = glatiramer acetate . * = teriflunomide (0.2%), glatiramer acetate (0.19%), interferon beta 1a (0.17%) for the i/hDMT group.