Chapter 5 Effectiveness of disease-modifying treatment on spinal cord lesion formation in relapse-onset MS. An MSBase registry study
Kreiter, D., Kalincik, T., Hupperts, R., Patti, F., Spitaleri, D., Foschi, M., … & Gerlach, O. (2024). Effectiveness of Disease-Modifying Treatment on Spinal Cord Lesion Formation in Relapse-Onset Multiple Sclerosis: An MSBase Registry Study. CNS drugs, 38(11), 921-930.
Abstract
Background Spinal cord lesions in multiple sclerosis (MS) have considerable impact on disability. High-efficacy disease-modifying treatments (hDMTs) are associated with greater reduction of relapses and new brain lesions compared to low-efficacy treatments (lDMTs). The knowledge about how DMTs impact cord lesion formation is limited as these outcome measures were not included in MS treatment trials. This study aims to investigate whether hDMTs reduce the formation of cord lesions more effectively than lDMTs.
Methods Patients with relapse-onset MS, a cord MRI within 6 months before/after initiation of their first DMT and ≥1 cord MRI at follow-up (interval > 6 months) were extracted from the MSBase registry (ACTRN12605000455662). Patients treated with hDMTs ≥90% or lDMTs ≥90% of follow-up duration were considered the hDMT and lDMT-group, respectively. Matching was performed using propensity-scores. Cox proportional hazards models were used to estimate the hazards of new cord lesions, brain lesions and relapses.
Results 94 and 783 satisfied hDMT- and lDMT-group criteria, respectively. 77 hDMT- were matched to 184 lDMT-patients. In the hDMT-group there was no evidence of reduction of new cord lesions (hazard ratio [HR] 0.99 [95% CI 0.51, 1.92], p=0.97), while there were less new brain lesions (HR 0.22 [95% CI 0.10, 0.49], p<0.001) and less relapses (HR 0.45 [95% CI 0.28, 0.72], p=0.004).
Conclusion A potential discrepancy exists in the effect of hDMTs over lDMTs in preventing spinal cord lesions versus brain lesions and relapses. While hDMTs provided a significant reduction for the latter when compared to lDMTs, there was no significant reduction in new spinal cord lesions.
5.1 Introduction
Multiple sclerosis (MS) is an immune-mediated inflammatory disease of the central nervous system involving both brain and spinal cord. In addition to brain lesions, approximately 80% of people with MS develop lesions within the spinal cord [170, 171], which are an important contributor to disability [235]. Spinal cord lesions, symptomatic as well as asymptomatic, are associated with more disability accrual in the long term and give an increased risk of secondary progression [171, 236]. Hence, the presence of spinal cord lesions generally warrants a more aggressive treatment strategy [31].
Disease-modifying treatments (DMT) aim at reducing disease-activity by targeting neuroinflammation, where a distinction is made between low- and high-efficacy DMTs, usually defined based on the degree of relapse reduction [237]. Of the DMTs currently used in clinical practice, no trials exist that report spinal cord lesions as an outcome. Consequently, little is known about whether DMTs do inhibit lesion formation in the cord like is the case for brain lesions. One single-center retrospective study of relapse-onset MS patients compared a group on intermediate- and high-efficacy DMTs to a matched group treated with no DMT and/or low-efficacy DMTs. There were significantly less new spinal cord lesions in the group with intermediate- and high-efficacy DMTs. However, when only patients with low-efficacy DMTs during follow-up were considered controls, the study was underpowered to show whether high-efficacy DMTs give a larger reduction in formation of new cord lesions than low-efficacy DMTs [238].
Important differences exist between the brain and spinal cord in MS. This argues that brain imaging outcomes in DMT studies should not just be extrapolated to the cord: Firstly, anatomical differences exist, for example in white/grey matter organization, volume and venous anatomy [239, 240]. Secondly, the blood-brain (BBB) and blood-spinal cord barrier (BSCB) are different in regard to composition, function and, subsequently, their permeability for various cytokines [241, 242]. Lastly, immunological differences seem to be at play as well. For example, there are indications that the balance between Th1 and Th17 helper cells (through IFNγ and IL-17) influence the degree of brain versus spinal cord involvement [59, 243]. These differences underline the importance to evaluate spinal cord separately from brain outcome measures.
In the present study we compared the occurrence of new spinal cord lesions in patients that started with a high-efficacy DMT as initial treatment to matched patients starting a low-efficacy DMT using observational data from the international MSBase registry. The aim is to improve our understanding on the effect of DMTs on spinal cord pathology in MS.
5.2 Methods
Observational patient-level data were collected from the MSBase registry (WHO International Clinical Trials Registry Platform identifier: ACTRN12605000455662). The MSBase Registry is an observational international MS database established in July 2004. Data are entered into the registry in a standardized manner, using iMed or the MSBase online data entry system. The entered MRI data is based upon local radiology reports. All code for data preparation and analysis can be found on https://github.com/danielkreiter/spinalcord-msbase. Data for this study was extracted on the 1st of July, 2022 (i.e. patients included between the start of the registry, July 2004, and data extraction, July 2022, could be included). Ethical approval for the MSBase registry was granted by the Melbourne Health Human Research Ethics Committee and institutional review boards at each site (or exemptions were granted according to local regulations). All patients provided informed consent as per local institutional regulations for inclusion of their data in the registry for clinical and research purposes.
5.2.1 Study population
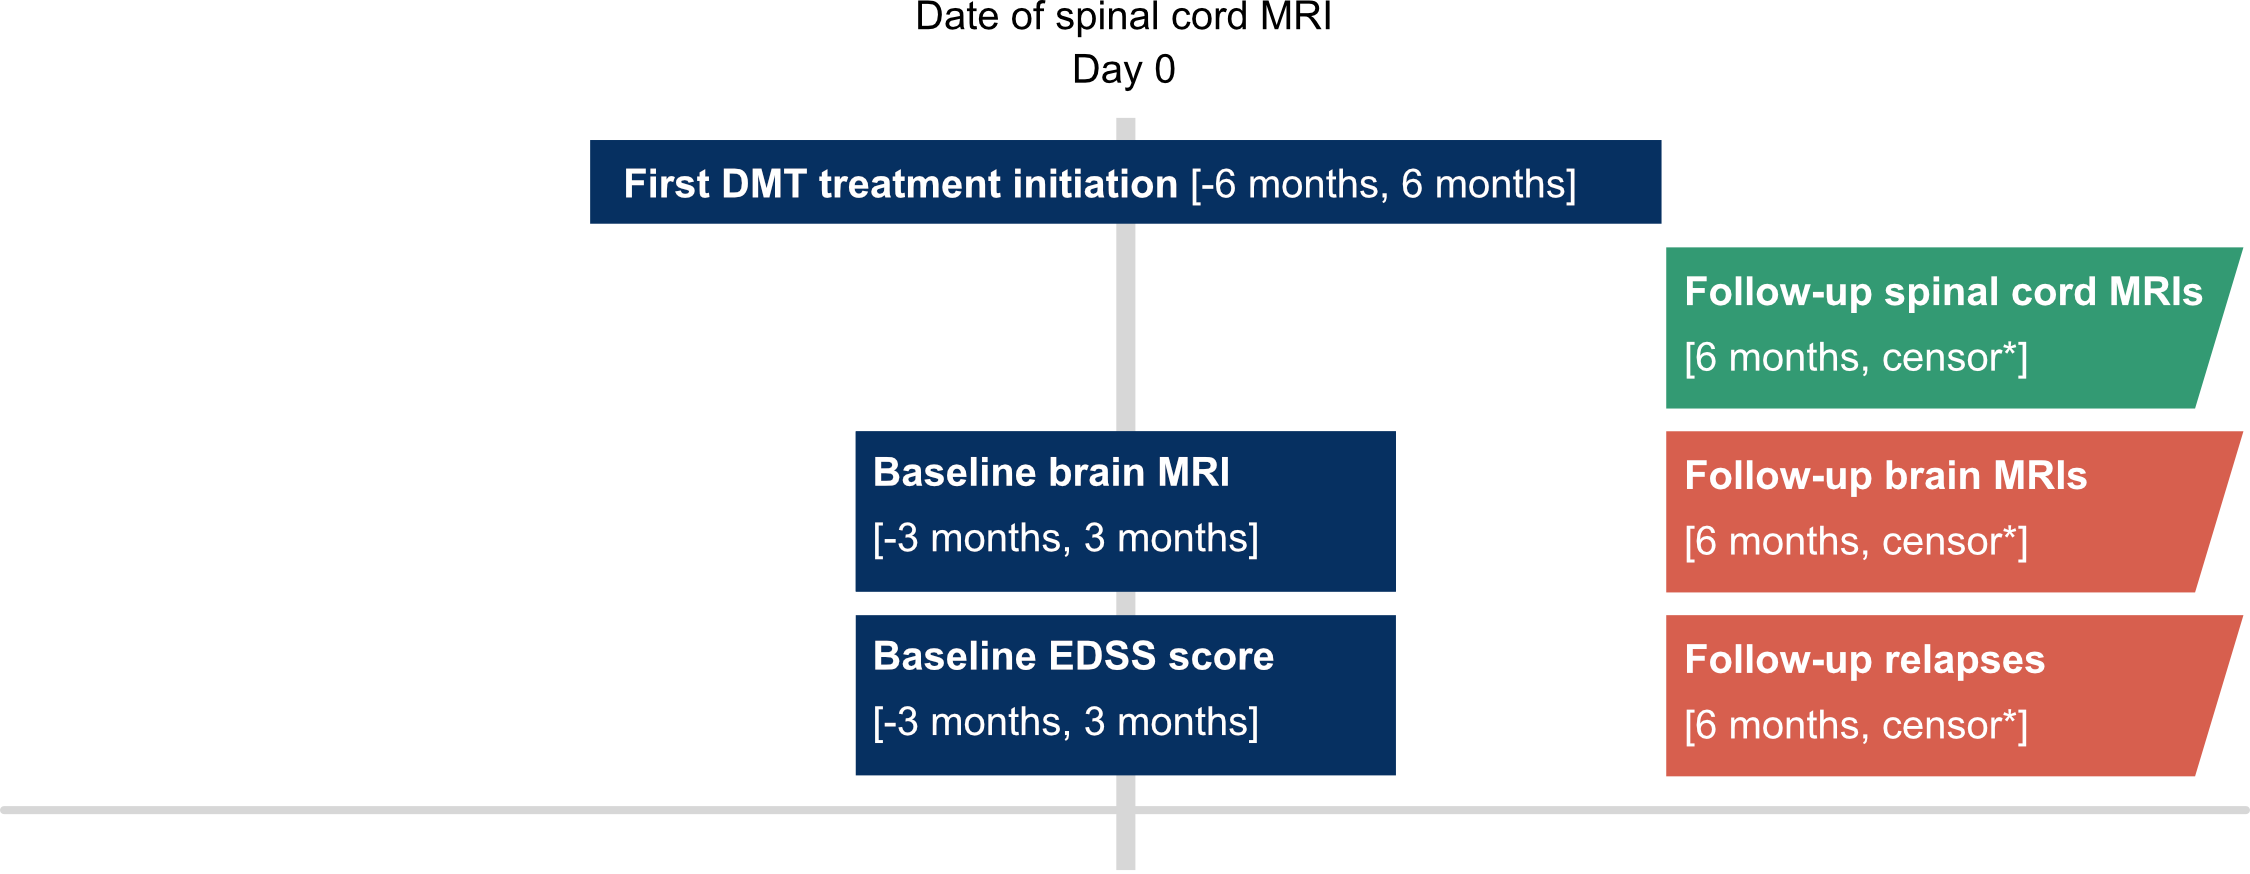
Relapse-onset MS patients were selected, who had at least (i) a spinal cord MRI (at minimum cervical cord coverage) within 6 months before or after initiation of a first DMT, (ii) brain MRI and an EDSS score within 3 months of baseline spinal cord MRI, (iii) another spinal cord MRI at minimum 6 months later, (iv) availability of a minimal baseline dataset (date of birth, sex, treating center, dates of disease onset, clinical definite diagnosis and relapses, treatment start/stop dates). Patients that received placebos, blinded trial medication or treatment not in the list of eligible treatments (see below) were excluded. For the procedures applied to identify any invalid or inconsistent entries, see supplement S1. For a visual overview of baseline definitions, see figure 2 [244].
Alemtuzumab, cladribine, mitoxantrone, natalizumab, ocrelizumab, ofatumumab, rituximab were classified as hDMTs [30, 245]. Interferons (beta-1a, beta-1b, peginteferon), glatiramer acetate, teriflunomide, methotrexate, azathioprine and immunoglobulins were considered lDMTs. For a clear distinction between the hDMT and lDMT groups, the S1P receptor modulators (S1Ps; fingolimod, ponesimod, ozanimod, siponimod) and dimethylfumarate (DMF) were excluded from the primary analysis. In the secondary analyses DMF and the S1P receptor modulators were included as hDMT. Patients treated with either lDMTs or hDMTs for ≥90% of the spinal cord MRI follow-up duration were included in respectively the lDMT- and hDMT-group. Follow-up time was defined as the longest possible spinal cord MRI follow-up in which treatment-group cutoffs remained satisfied. Patients receiving treatment from either class <90% of follow-up were excluded from the primary and secondary analyses. Since in most cases a time interval exists between the baseline spinal cord MRI and initiating the DMT, a 90% of follow-up cutoff was chosen instead of 100%. To assess the impact of the chosen cut-off, sensitivity analyses with ≥95% and ≥80% cutoff were performed as well.
To account for the differences in duration of the treatment effect between therapies. The assumed duration of treatment effect after the last dose was based on data on the duration of biological effectiveness and values used in earlier studies: 2 months for natalizumab [245]; 6 months for mitoxantrone, ocrelizumab, rituximab and ofatumumab [245–247]; 5 years for alemtuzumab [245]; 96 weeks for cladribine [128]. For the other therapies, the treatment effect was assumed to last until the last dose.
5.2.2 Outcome
The primary outcome event was new spinal cord lesions during follow-up (new T2 or T1-Gd+ lesions), where the first spinal cord MRI (within 6 months before or after DMT initiation) is considered the baseline. Relapses and new brain MRI lesions were secondary outcomes included as validation, given that for these outcome measures there is a known stronger protective effect of hDMTs over lDMTs. Patients could have had repeated events during follow-up.
5.2.3 Statistical analysis
Patients from both treatment groups were matched using propensity scores based on clinical (age, sex, time since first clinical event, EDSS, number of relapses in the preceding 12 months, number of relapses in the preceding 24 months, country) and radiological parameters (baseline number of brain and cord MRI lesions) [248]. Nearest-neighbor matching with a 1:3 variable ratio, without replacement and caliper of 0.1 was performed using the MatchIt R-package [249]. The balance of baseline covariates was assessed using the standardized mean difference (SMD). An SMD of < 0.2 was considered a negligible difference in the mean of a covariate between groups. All subsequent analyses using matched data were weighted to take the variable matching ratio into account. The common follow-up for each matched pair was determined as the shorter of the pairs follow-up periods (pairwise censoring) in order to mitigate attrition bias.
Cox proportional hazards models were applied on matched data to estimate the risk ratio of new spinal lesions, new brain lesions and relapses between treatment groups. In case of repeated events (i.e., multiple relapses, new brain or cord lesions during follow-up) these were all included in the time-to-event analyses. Cumulative hazard plots were used to visualize time-to-event data. All statistical analyses were performed in R version 4.2.1.
A secondary analysis was carried out including S1Ps and one with both S1Ps and DMF as hDMT. To evaluate the robustness of the results and the influence of methodological choices, four sensitivity analyses were performed: (i) changing the group-cutoff of ≥90% lDMT/hDMT treatment of follow-up duration to 95% or (ii) 80% to assess the impact of the chosen cutoff. Additionally, to assess the influence of matching procedure parameters, sensitivity analyses (iii) using a broad caliper in the matching procedure (1:10 match, with broad caliper of 0.4) were performed. In the final sensitivity analysis, (iv) the broad caliper was combined with an 80% cutoff to assess the effect of using a parameter set that maximizes the included sample size.
All analyses were corrected for multiple testing using the Benjamini-Hochberg procedure, adjusted p-values are reported unless stated otherwise. Where in the primary analysis no evidence of a significant difference was found between the compared groups, the minimum detectable effect (MDE) was calculated within the available cohort at 1 – β = 0.80 and α = 0.05 with 200 simulations per outcome [250].
5.3 Results
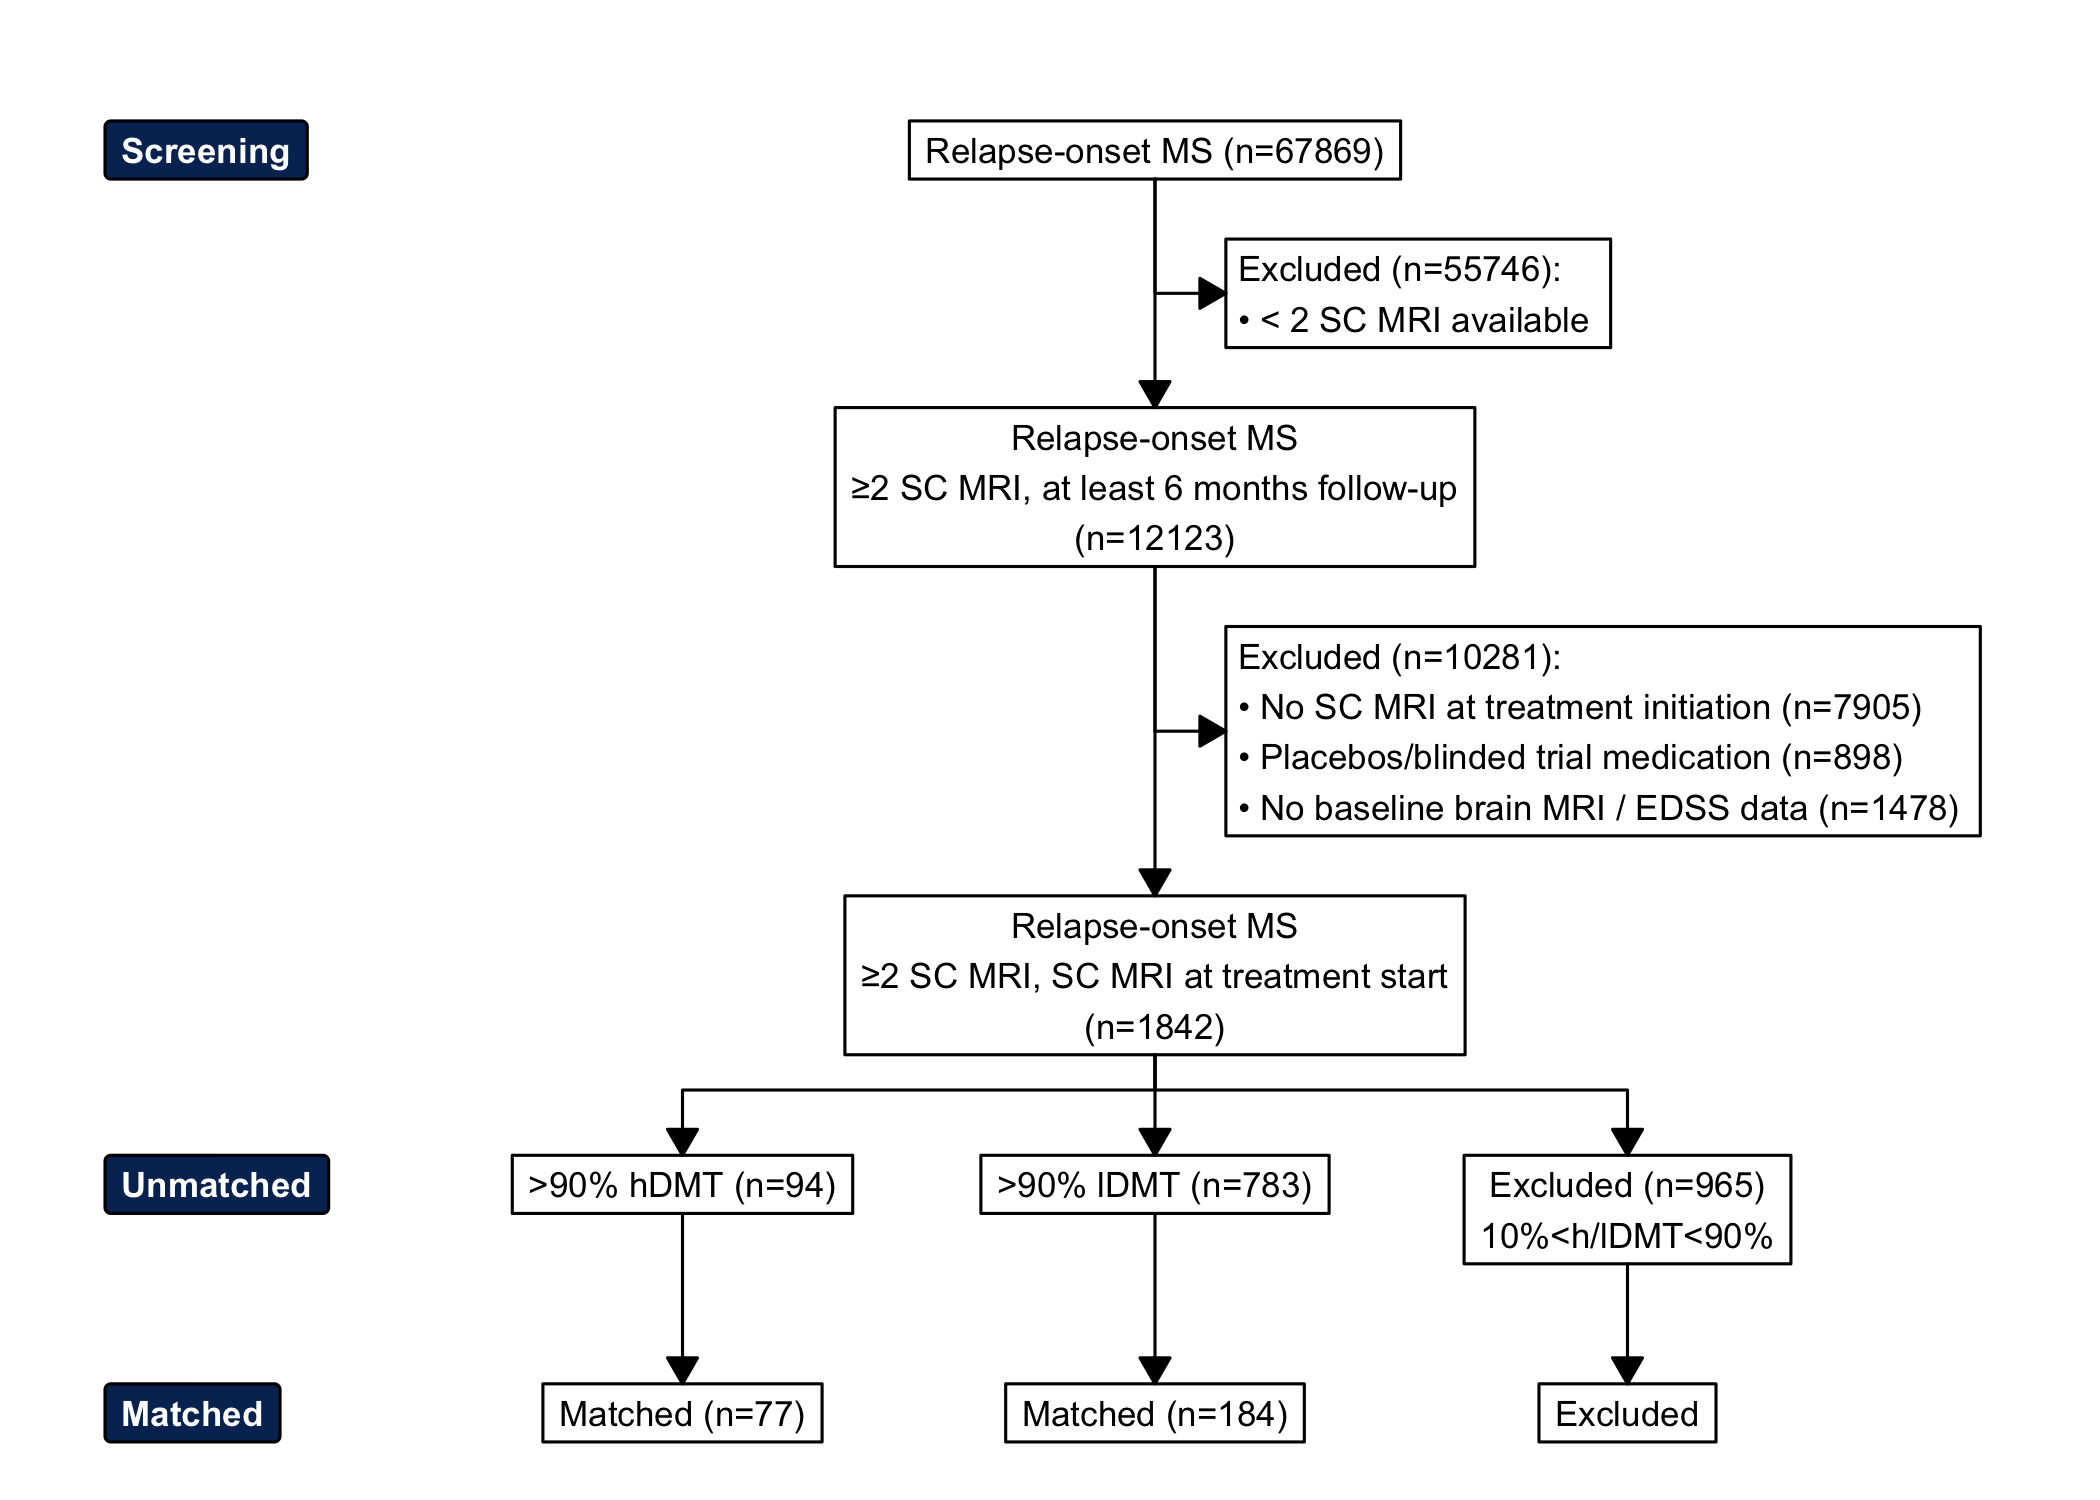
Figure 5.1: Flowchart of screening, inclusion and matching of study population. SC = spinal cord, hDMT = high-efficacy disease modifying treatment, lDMT = low-efficacy disease modifying treatment, EDSS = Expanded Disability Status Scale.
1842 patients were identified with a relapse-onset MS who underwent spinal cord MRI within a time window of 6 months around initiation of their first DMT and had at least one more spinal cord MRI at follow-up (minimal interval 6 months after baseline spinal cord MRI). 68.7% of spinal cord MRIs covered the whole cord, the rest covered only the cervical cord. In 82.5% of cord investigations post-gadolinium sequences were acquired. Figure 1 shows the flowchart of patient selection and exclusion. 94 and 783 satisfied hDMT- and lDMT-group criteria, respectively. 77 hDMT-patients were matched to 184 lDMT-patients. Patient characteristics before and after matching are shown in table 1. The two matched groups were well balanced on the measured characteristics at baseline (standardized mean difference < 0.2). For additional figures on the matching procedure, see supplement S2. The list of countries of where patients were treated can be found in supplement S3. Treatments used during follow-up in both treatment groups (total groups and the subgroups that developed new cord lesions) as proportion of the total follow-up time are shown in figure 2.
| Unmatched |
| Matched |
| ||
|---|---|---|---|---|---|---|
Characteristic | hDMT | lDMT | SMD2 | hDMT, N = 771 | lDMT, N = 1841 | SMD2 |
Age | 37 (29, 46) | 33 (26, 40) | 0.33 | 37 (29, 46) | 35 (28, 43) | 0.01 |
Sex | ||||||
F | 61 (65%) | 554 (71%) | 0.12 | 47 (61%) | 115 (63%) | 0.00 |
M | 33 (35%) | 229 (29%) | 0.12 | 30 (39%) | 69 (38%) | 0.00 |
EDSS | 2.5 (2.0, 4.5) | 2.0 (1.0, 2.5) | 0.74 | 2.5 (2.0, 4.0) | 2.5 (1.5, 3.0) | 0.00 |
Baseline brain lesions | ||||||
0 | 2 (2.1%) | 9 (1.1%) | 0.07 | 2 (2.6%) | 1 (0.5%) | 0.09 |
1-2 | 0 (0%) | 21 (2.7%) | 0.18 | 0 (0%) | 0 (0%) | 0.00 |
3-8 | 9 (9.6%) | 187 (24%) | 0.49 | 9 (12%) | 26 (14%) | 0.05 |
9+ | 83 (88%) | 566 (72%) | 0.50 | 66 (86%) | 157 (85%) | 0.09 |
Baseline spinal cord lesions | 3.0 (1.0, 6.0) | 1.0 (0.0, 2.0) | 0.70 | 3.0 (1.0, 5.0) | 2.0 (1.0, 4.0) | 0.09 |
Relapses in past year | 1.5 (1.0, 2.0) | 1.0 (1.0, 1.0) | 0.43 | 1.0 (1.0, 2.0) | 1.0 (1.0, 2.0) | 0.03 |
Relapses in past 2 years | 2.0 (1.0, 2.0) | 1.0 (1.0, 2.0) | 0.35 | 2.0 (1.0, 2.0) | 1.0 (1.0, 2.0) | 0.04 |
Years since first symptoms | 5.7 (7.2) | 3.2 (5.0) | 0.35 | 4.7 (6.7) | 4.1 (6.2) | 0.10 |
Days between baseline spinal cord MRI and treatment initiation | 37 days (21 days, 56 days) | 29 days (14 days, 58 days) | 35 days (21 days, 55 days) | 34 days (16 days, 67 days) | ||
Follow-up in years3 | 2.5 (1.8, 3.6) | 3.1 (1.7, 5.4) | 2.4 (1.6, 3.1) | 3.6 (1.8, 5.6) | ||
1Median (Q1, Q3); n (%); Mean (SD) | ||||||
2Standardized mean difference | ||||||
3Before pairwise censoring | ||||||
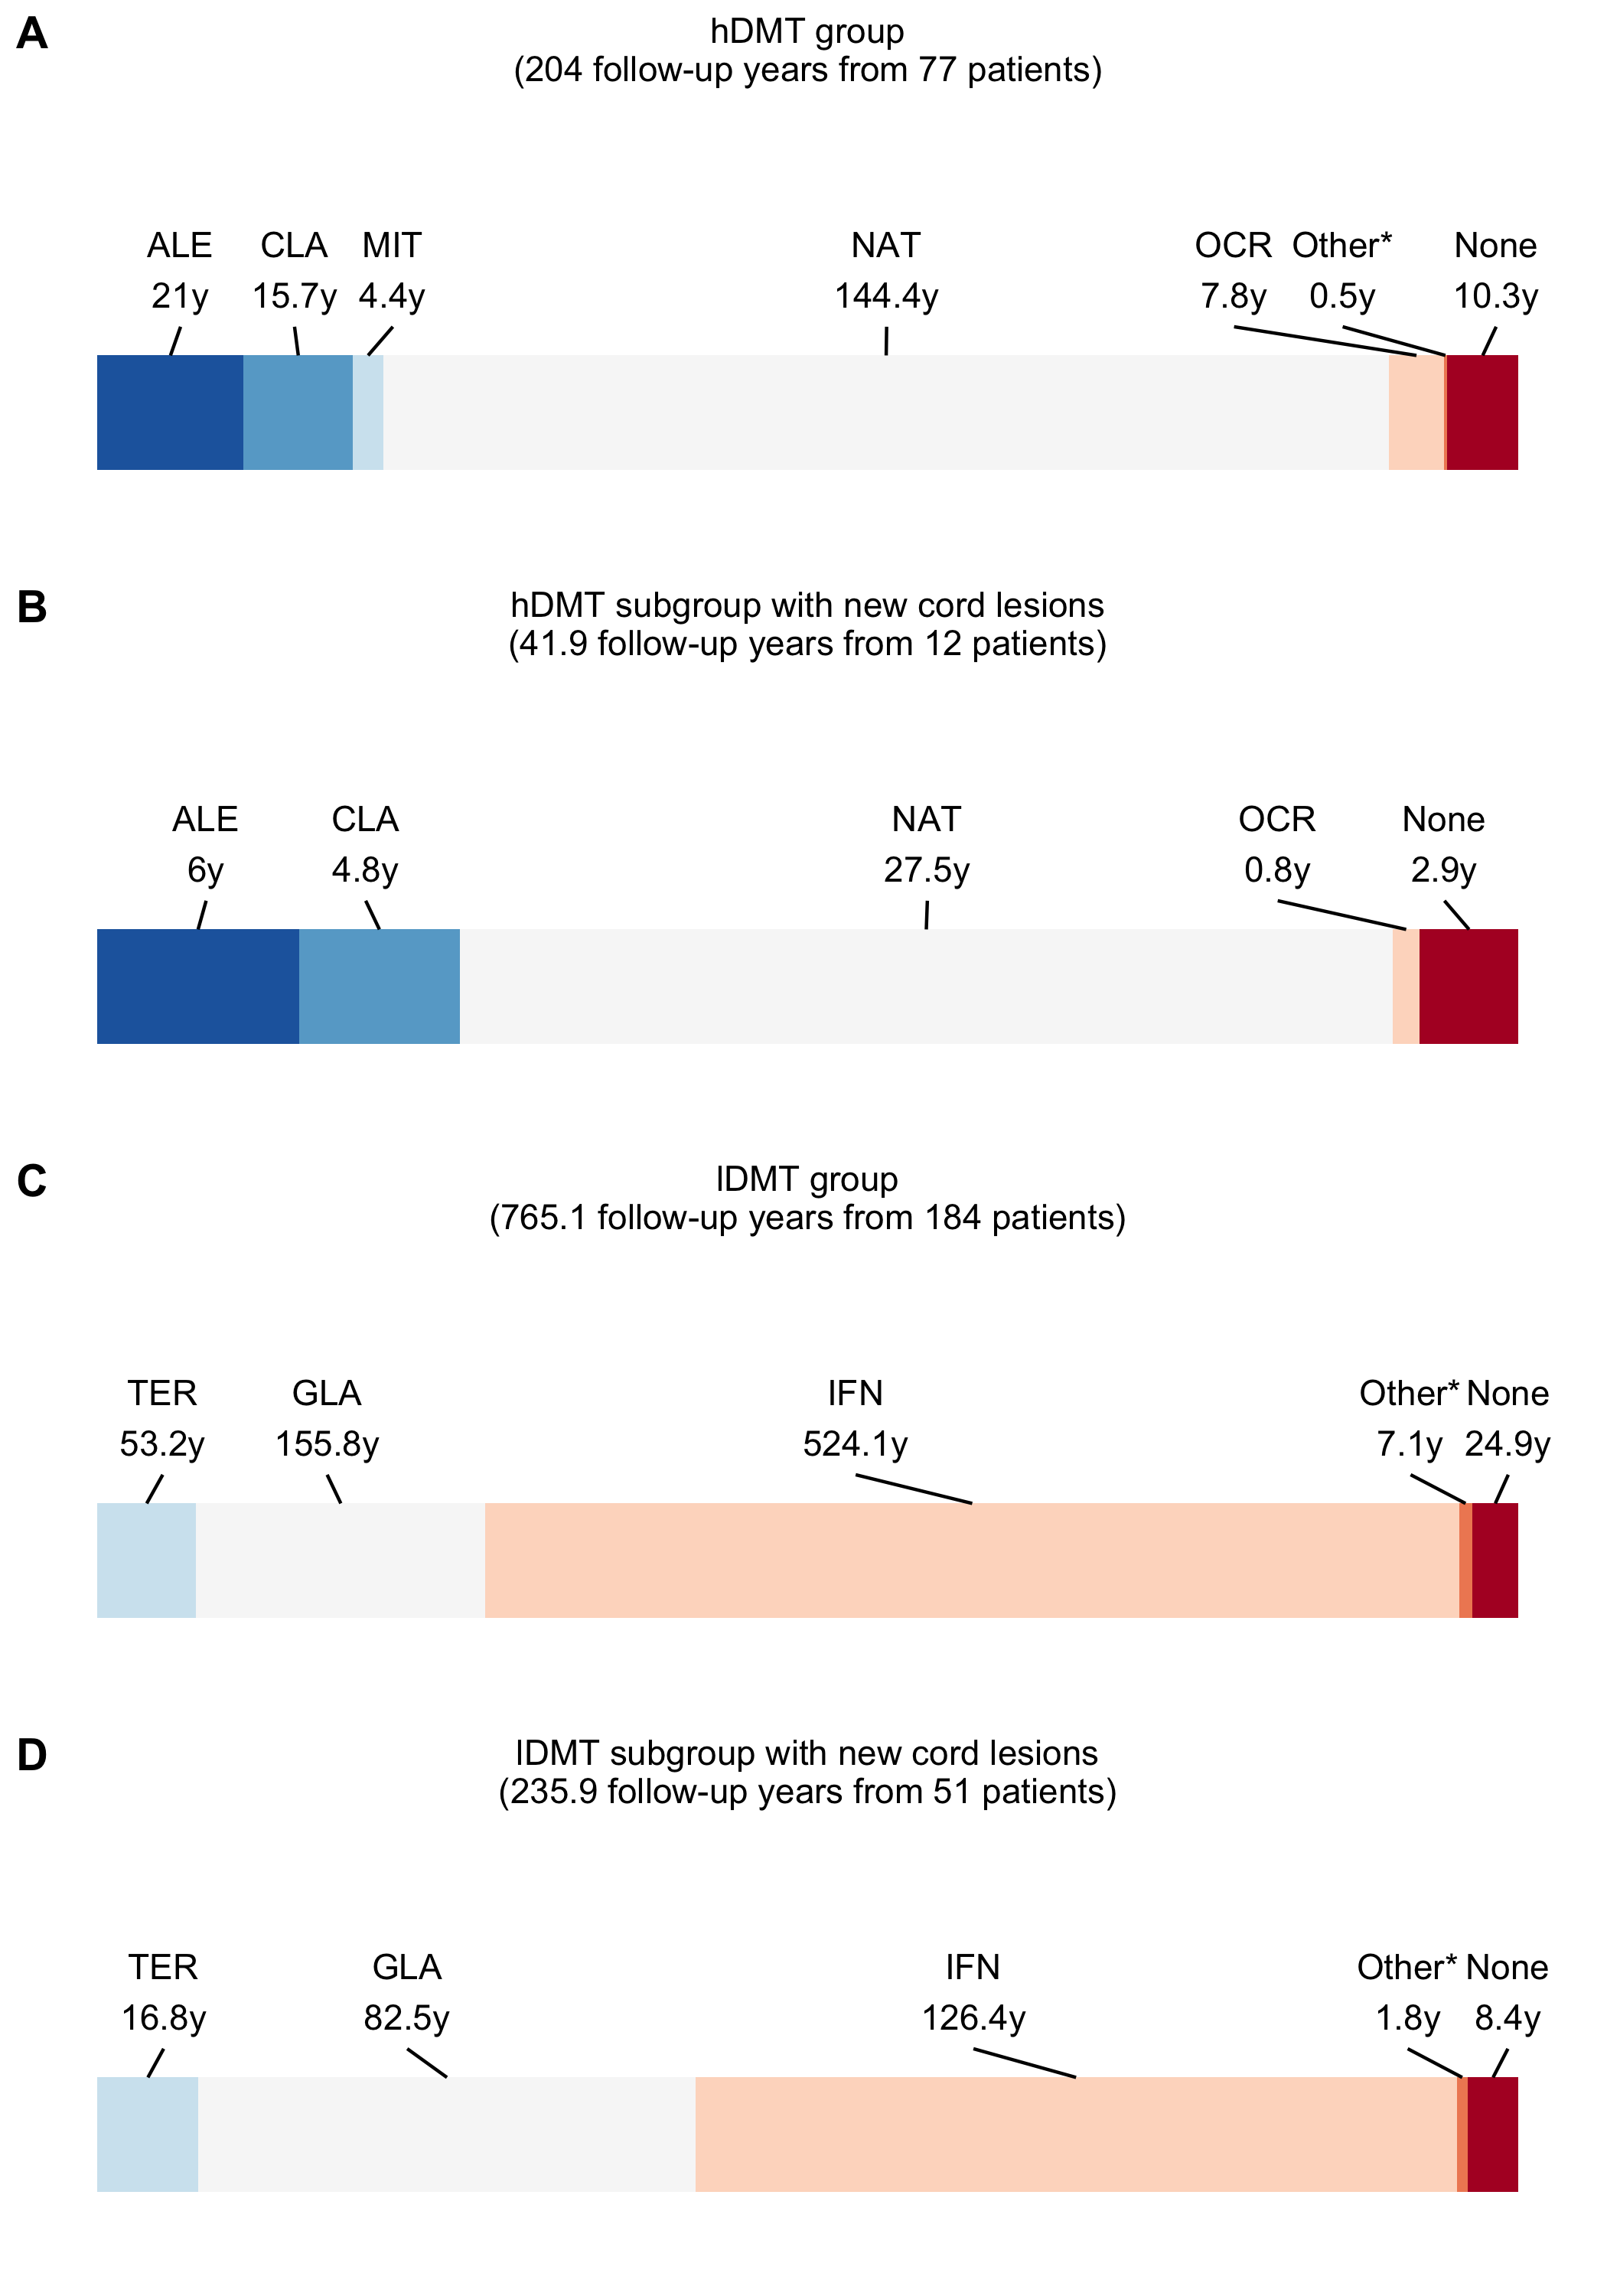
Figure 5.2: DMT usage during follow-up as proportion of follow-up time. AZA = azathioprine, ALE = alemtuzumab, CLA = cladribine, DMF = dimethylfumarate, NAT = natalizumab, FIN = fingolimod, GLA = glatiramer acetate, IVIG = immunoglobulins, IFN = interferons, MIT = mitoxantron, MTX = methotrexate, OFA = ofatumumab, OCR = ocrelizumab, RTX = rituximab, PON = ponesimod, ONA = ozanimod, SIP = siponimod, TER = teriflunomide . * = fingolimod (0.06%), glatiramer acetate (0.17%) for the hDMT-group. In the control group: methotrexate (0.21%), dimethylfumarate (0.03%), natalizumab (0.13%), fingolimod (0.12%), siponimod (0.44%) . In the subgroup with new cord lesions in the control group: methotrexate (0.67%), natalizumab (0.1%) .
At baseline, 81.2% of matched patients had at least one spinal cord lesion (60.5% in unmatched cohort). In the hDMT-group there were 12 (15.6%) patients that developed 12 new cord lesions (mean follow-up 2.6 years; 0.06 lesions per patient year; 55.6% gadolinium-enhancing). In the lDMT-group, 51 (27.7%) patients developed 65 new cord lesions (mean follow-up 4.2 years [SD 3.0]; 0.08 lesions per patient year; 41.3% gadolinium-enhancing). After pairwise censoring, mean follow-up time was 2.07 years (SD 1.2, range 0.5-8.29 years). There was no statistically or clinically significant difference in the risk of new cord lesions between groups (HR 0.99, [95% CI 0.51, 1.92], p=0.969). As can also be seen in figure 3. This while there were less new brain lesions (HR 0.22, [95% CI 0.1, 0.49], p<0.001) on MRI and relapses (HR 0.45, [95% CI 0.28, 0.72], p=0.004) in the hDMT- compared to the lDMT-group. When S1Ps and DMF were included as hDMT, there was a similar pattern (see table 2).
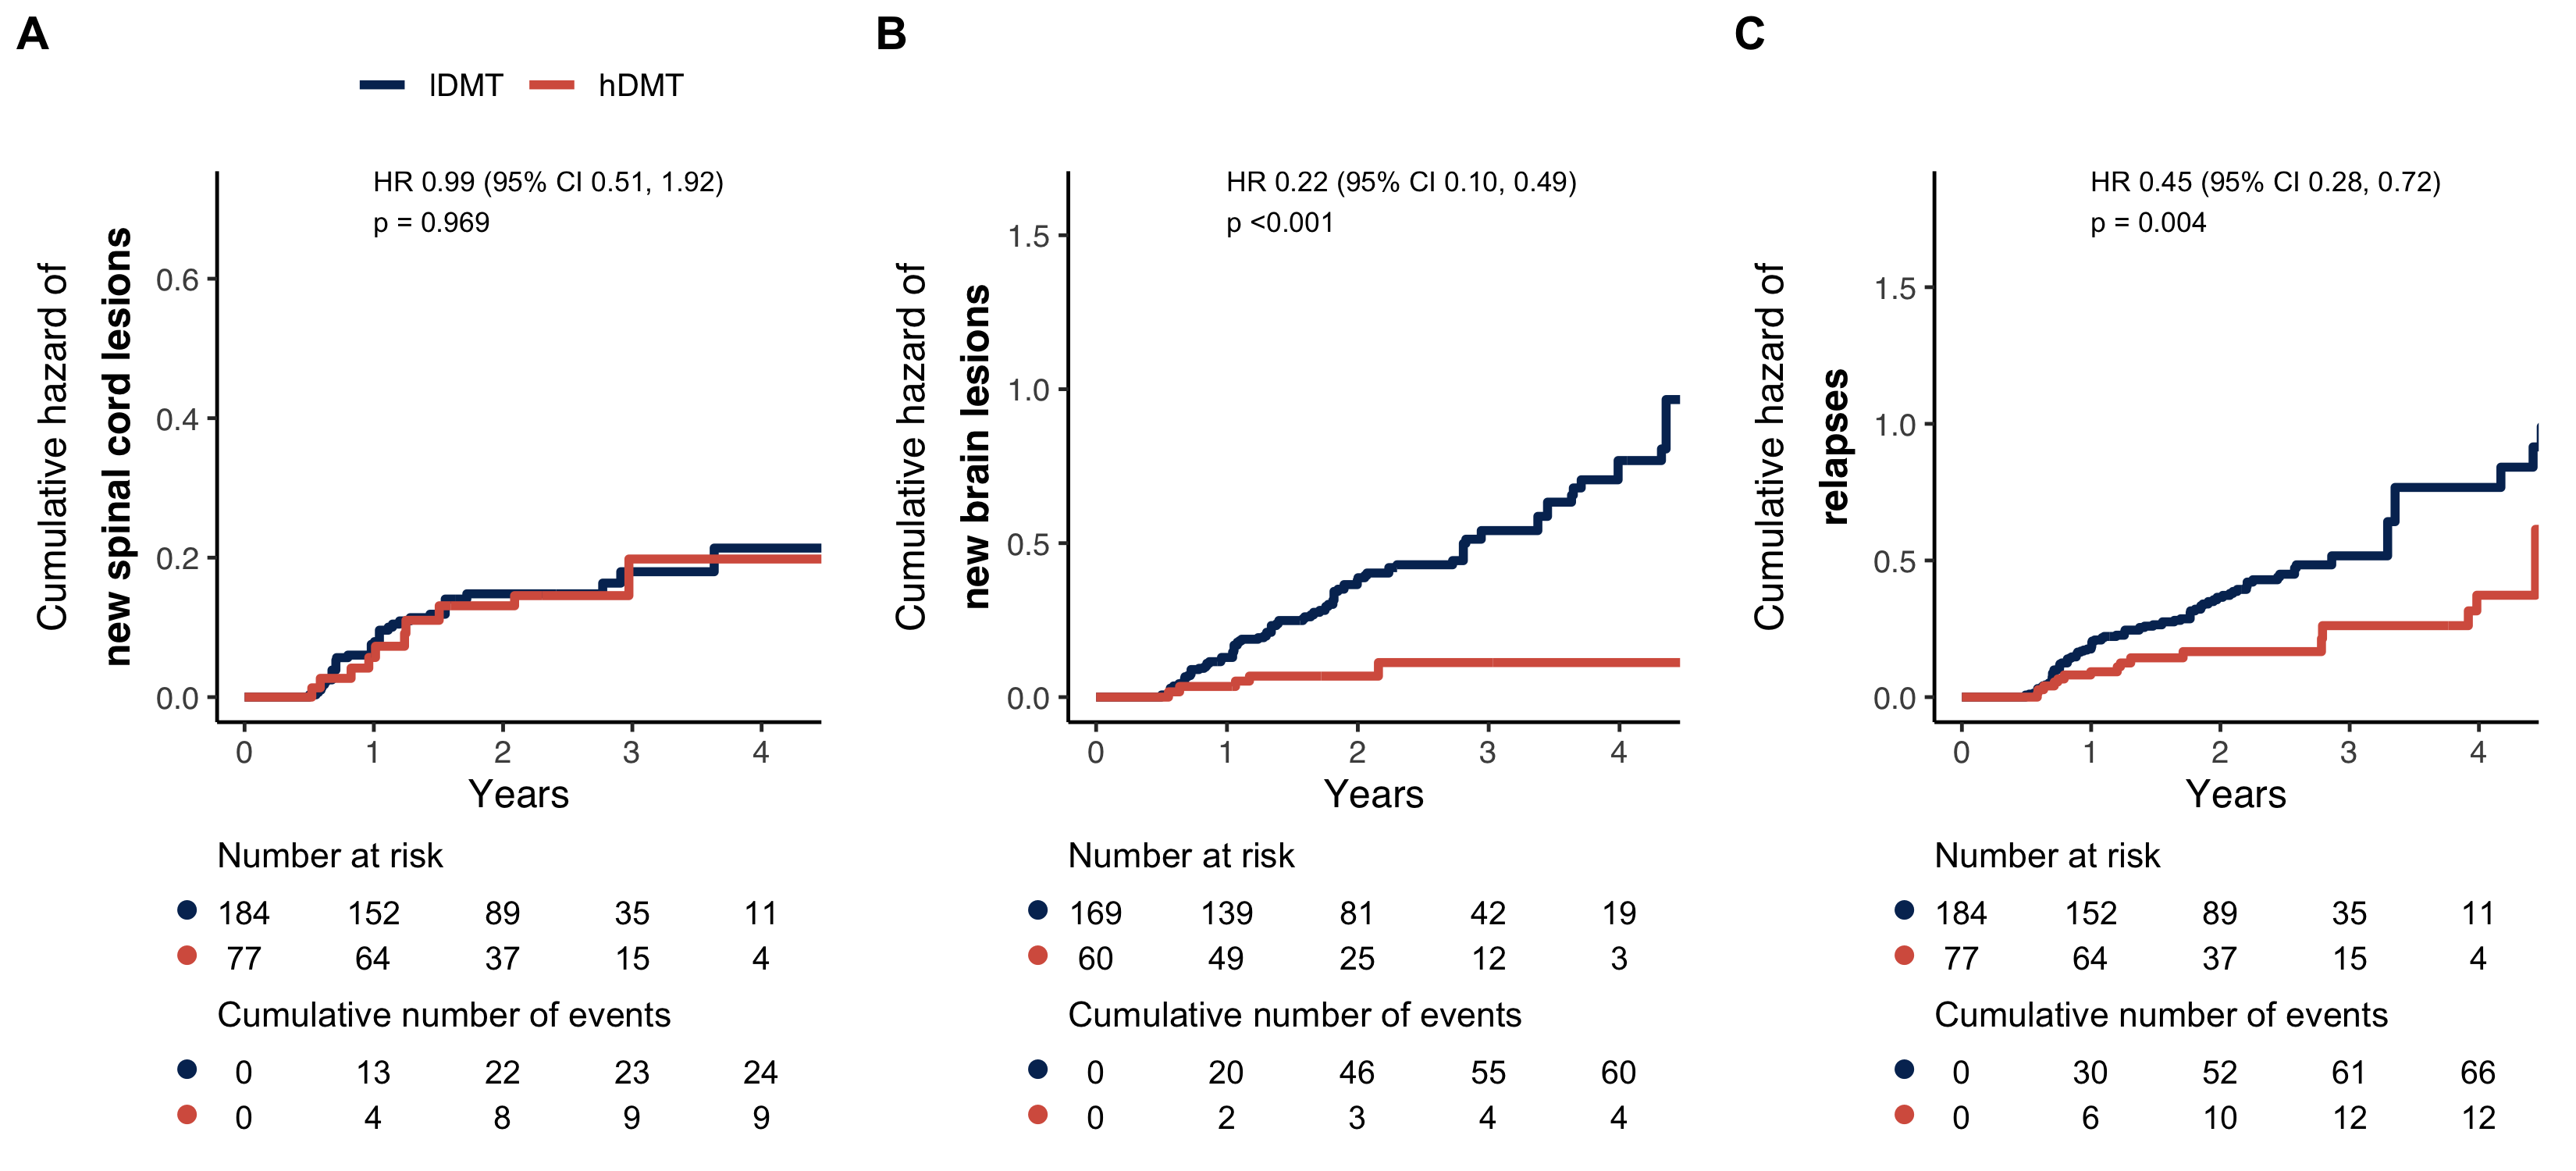
Figure 5.3: Cumulative hazard plots and risk tables for (A) new spinal cord lesions, (C) new brain lesions and (C) relapses in the hDMT vs. lDMT group. HR = hazard ratio, CI = confidence interval, hDMT = high-efficacy disease modifying treatment, lDMT = low-efficacy disease modifying treatment.
Sensitivity analyses showed similar results of which an overview is shown in table 2. Although, here the differences in the occurrence of spinal cord lesions were somewhat larger (HRs between 0.58 and 0.70 across the different sensitivity analyses) but not statistically significant. Analysis of the minimum detectable effect size was preformed for the primary analyses that did not show statistically significant differences, which was only the case for the occurrence of new cord lesions. This analysis was sufficiently powered to detect a minimum difference of 55% in cumulative hazard for new spinal cord lesions.
|
Unmatched
|
Matched
|
Cord lesions
|
Relapses
|
Brain lesions
|
||||||
|---|---|---|---|---|---|---|---|---|---|---|
| lDMT n |
hDMT n |
lDMT n |
hDMT n |
HR (95% CI) | Adj. p | HR (95% CI) | Adj. p | HR (95% CI) | Adj. p | |
| Primary & secondary analysis | ||||||||||
| without DMF & S1Ps | 783 | 94 | 184 | 77 | 0.99 (0.51-1.92) | 0.969 | 0.45 (0.28-0.72) | 0.004 | 0.22 (0.10-0.49) | <0.001 |
| with S1Ps | 782 | 133 | 262 | 112 | 0.85 (0.53-1.35) | 0.539 | 0.45 (0.30-0.66) | 0.001 | 0.55 (0.32-0.94) | 0.051 |
| with S1Ps & DMF | 782 | 161 | 350 | 143 | 0.99 (0.65-1.50) | 0.969 | 0.73 (0.53-1.00) | 0.073 | 0.54 (0.36-0.80) | 0.006 |
| Sensitivity analysis | ||||||||||
| cutoff 80% | 917 | 116 | 234 | 94 | 0.68 (0.39-1.19) | 0.234 | 0.40 (0.24-0.67) | 0.002 | 0.54 (0.29-0.99) | 0.073 |
| cutoff 95% | 583 | 68 | 126 | 55 | 0.62 (0.29-1.31) | 0.262 | 0.72 (0.41-1.27) | 0.300 | 0.38 (0.18-0.77) | 0.017 |
| broad caliper | 783 | 94 | 477 | 129 | 0.70 (0.44-1.12) | 0.186 | 0.64 (0.46-0.88) | 0.017 | 0.41 (0.25-0.65) | 0.001 |
| broad caliper, cutoff 80% | 917 | 116 | 441 | 113 | 0.58 (0.35-0.95) | 0.051 | 0.37 (0.24-0.56) | <0.001 | 0.54 (0.33-0.90) | 0.039 |
5.4 Discussion
This observational propensity score-matched study of patients with relapse-onset MS aimed to show whether treatment with hDMTs results in a larger reduction of new spinal cord lesions when compared to lDMTs. The study found no evidence of difference for the occurrence of new cord lesions between the hDMT and lDMT groups. In contrast, the study found a reduction of new brain lesions and relapses in the hDMT when compared with lDMT. Therefore, while earlier literature suggests that using a DMT in general reduces the formation of new spinal cord lesions [238], currently there is no evidence for a larger reduction of spinal cord disease activity when using hDMTs compared to lDMTs, as is the case for brain lesions and clinical relapses.
While the primary analysis convincingly shows no difference in new cord lesions between groups, the sensitivity analysis using a broad caliper combined with a loosened cutoff for the proportion of follow-up duration used for the definition of treatment groups (≥80% instead of ≥90%) showed some difference between groups for new cord lesions (HR 0.58, p=0.05). While these liberal parameters led to a larger included sample, with still small differences in baseline group characteristics (SMD < 0.1, see supplement S4), this result needs to be interpreted with caution, since that the 20% of time not on the group-defining medication could be of influence.
A possible reason for the discrepancy in the effect of hDMTs in preventing new cord lesions versus brain lesions lies in the differences between brain and spinal cord in regard to anatomical organization, BBB/BSCB composition and function [241], regional immunological differences [243, 251, 252] and maybe also in repair capabilities [161, 253, 254].
Exploratively comparing the medications being used in the group of patients that developed new cord lesions while under a hDMT to the group that did not (see figure 2), there are no striking differences in regard to which treatments were used. Therefore, currently, there are no indications that one subgroup of hDMTs would have a more potent effect on the spinal cord compartment of the CNS. This contrasts with a smaller recent local cohort study, where cord lesions were less common in patients being treated with B-cell depleting therapies [238].
With the use of conventional MRI, like in the present study, we can only address focal inflammatory demyelinating activity for which focal lesions on MRI are a marker [255]. However, diffuse inflammation and axonal loss in the cord are other important components of cord pathology resulting in disability worsening [256, 257]. Therefore, we do not know whether these different groups of DMTs have a different effect on the relevant pathological processes other than focal demyelination. Currently, quantification of diffuse inflammation and demyelination in the CNS in vivo, and even more in the spinal cord, is still challenging and requires advanced imaging techniques which currently are not easily applied in clinical practice [258, 259].
5.4.1 Limitations & strengths
Inherent to the use of registry-based data in this study, there are some important limitations. A main limitation is the absence of systematic and comparable acquisition of radiological outcomes and the lack of information in the registry on acquisition methods. Since that spinal cord MRI imaging is challenging in acquisition as well as the assessment, and artifact-prone, detection of lesions is very dependent on the quality of the investigation. Also, information on the field strength on which the investigations were performed was not available. But, in contrast to brain imaging, the difference in lesion sensitivity between 1.5T and 3T seems limited for spinal cord MRI [215]. Still, in regard to acquisition, it is not expected that there would be a structural difference to this regard between the two groups. One has to bear in mind, that the incidence of new spinal cord lesions in this study is probably not representative for the true occurrence of new cord lesions. Spinal cord MRI is currently not an investigation performed routinely at follow-up [20] and is mostly performed at discretion of the clinician. This means that the included patients (who had >1 spinal cord MRI) were probably patients with either new cord-related symptoms, unexplained disability progression, that possibly switched therapies during follow-up or were followed-up with cord MRI due to earlier cord lesions. This could have resulted in patients with good therapy response to be underrepresented in both groups. Finally, given the minimum detectable difference of 55%, a small-to-moderate reduction of the risk of spinal cord activity when using hDMTs compared to lDMTs for new cord lesions can not be fully ruled out.
With regard to the propensity-scores, ideally, gadolinium-enhancing lesions on MRI and CSF markers (number of oligoclonal bands, IgG index) would also be part of the covariates used in the matching procedure, since these are also considered in treatment decisions in clinical practice. However, due to the degree of incomplete cases this would lead to, these were not included.
Furthermore, a large number of patients could not be included because there was no spinal cord MRI close enough to treatment initiation (see figure 1). For a large part this could be due to more limited registration of spinal cord MRIs in the registry compared to brain MRIs, since that spinal cord MRI is a routine part of the diagnostic workup in international guidelines. However, when patients initiate treatment not after diagnosis but later at follow-up, it is likely that there is a certain number of cases where there was no rebaseline spinal cord MRI causing them not be included in this study. However, this is unlikely to have caused a structural difference between groups. Also, there were differences in the median follow-up time, where the median follow-up time in the lDMT group was longer than in the hDMT group. A possible reason is that in the lDMT-group relapses or progression occurred more often until longer after baseline leading to more spinal cord MRIs being performed until later after baseline. To avoid attrition bias, this has been accounted for in the analyses by adapting pairwise-censoring.]{.track}
A strength of this study is the application of matching to address confounding by severity and the matching resulted in similar groups across the important determinants. But it is still possible that differences exist between the groups on unmeasured variables. Another strength of this registry-based study is that it is a multicentric study including patients from all over the world. Although, it is important to note that the main part of the sample consisted of patients from Italy followed by Turkey and Australia.
5.5 Conclusion
In conclusion, there is currently no evidence that hDMT usage results in a larger reduction of new cord lesions than lDMTs, as is the case for new brain lesions and relapses. Whilst, this is an interesting and important finding, results need to be interpreted with caution as the present registry study has important limitations as discussed in the limitations section. The current findings should be considered a plea to work towards more and a higher level of evidence to either confirm or reject the presently suggested discrepancy of the hDMT effect on brain lesions and relapses versus spinal cord lesions. To be able to gain further insight into the effect of DMTs on spinal cord pathology in MS, it is necessary to (i) more often include spinal cord outcome measures in MS drug trials and prospective observational cohorts, (ii) encourage registration of spinal cord data in MS registries and (iii) study the interplay between therapies and the different MS pathological processes in the cord using advanced imaging techniques, which have increasingly become part of the research toolbox.
Supplements
S1 - Data quality procedure
- Duplicate patients were removed.
- Patients with missing date of birth, date of first symptoms and date of diagnosis were excluded.
- Patients with onset dates after MSBase data extraction were removed.
- A logical MS course (e.g. clinically isolated syndrome, relapsing- remitting MS, secondary progressive MS) was assured.
- MRI investigations with insufficient data (e.g. missing information on whether there were new lesions) were removed.
- Duplicate MS relapses, EDSS scores, MRI investigations, visits and treatment entries were merged
- EDSS scores outside the possible EDSS range were removed.
- Relapses occurring within 30 days of each other were merged.
- MS disease modifying therapies were identified and labelled.
- Invalid treatment entries were removed (e.g. start date > end date, initiation after the MSBase data extract date).
S2 - Propensity score matching
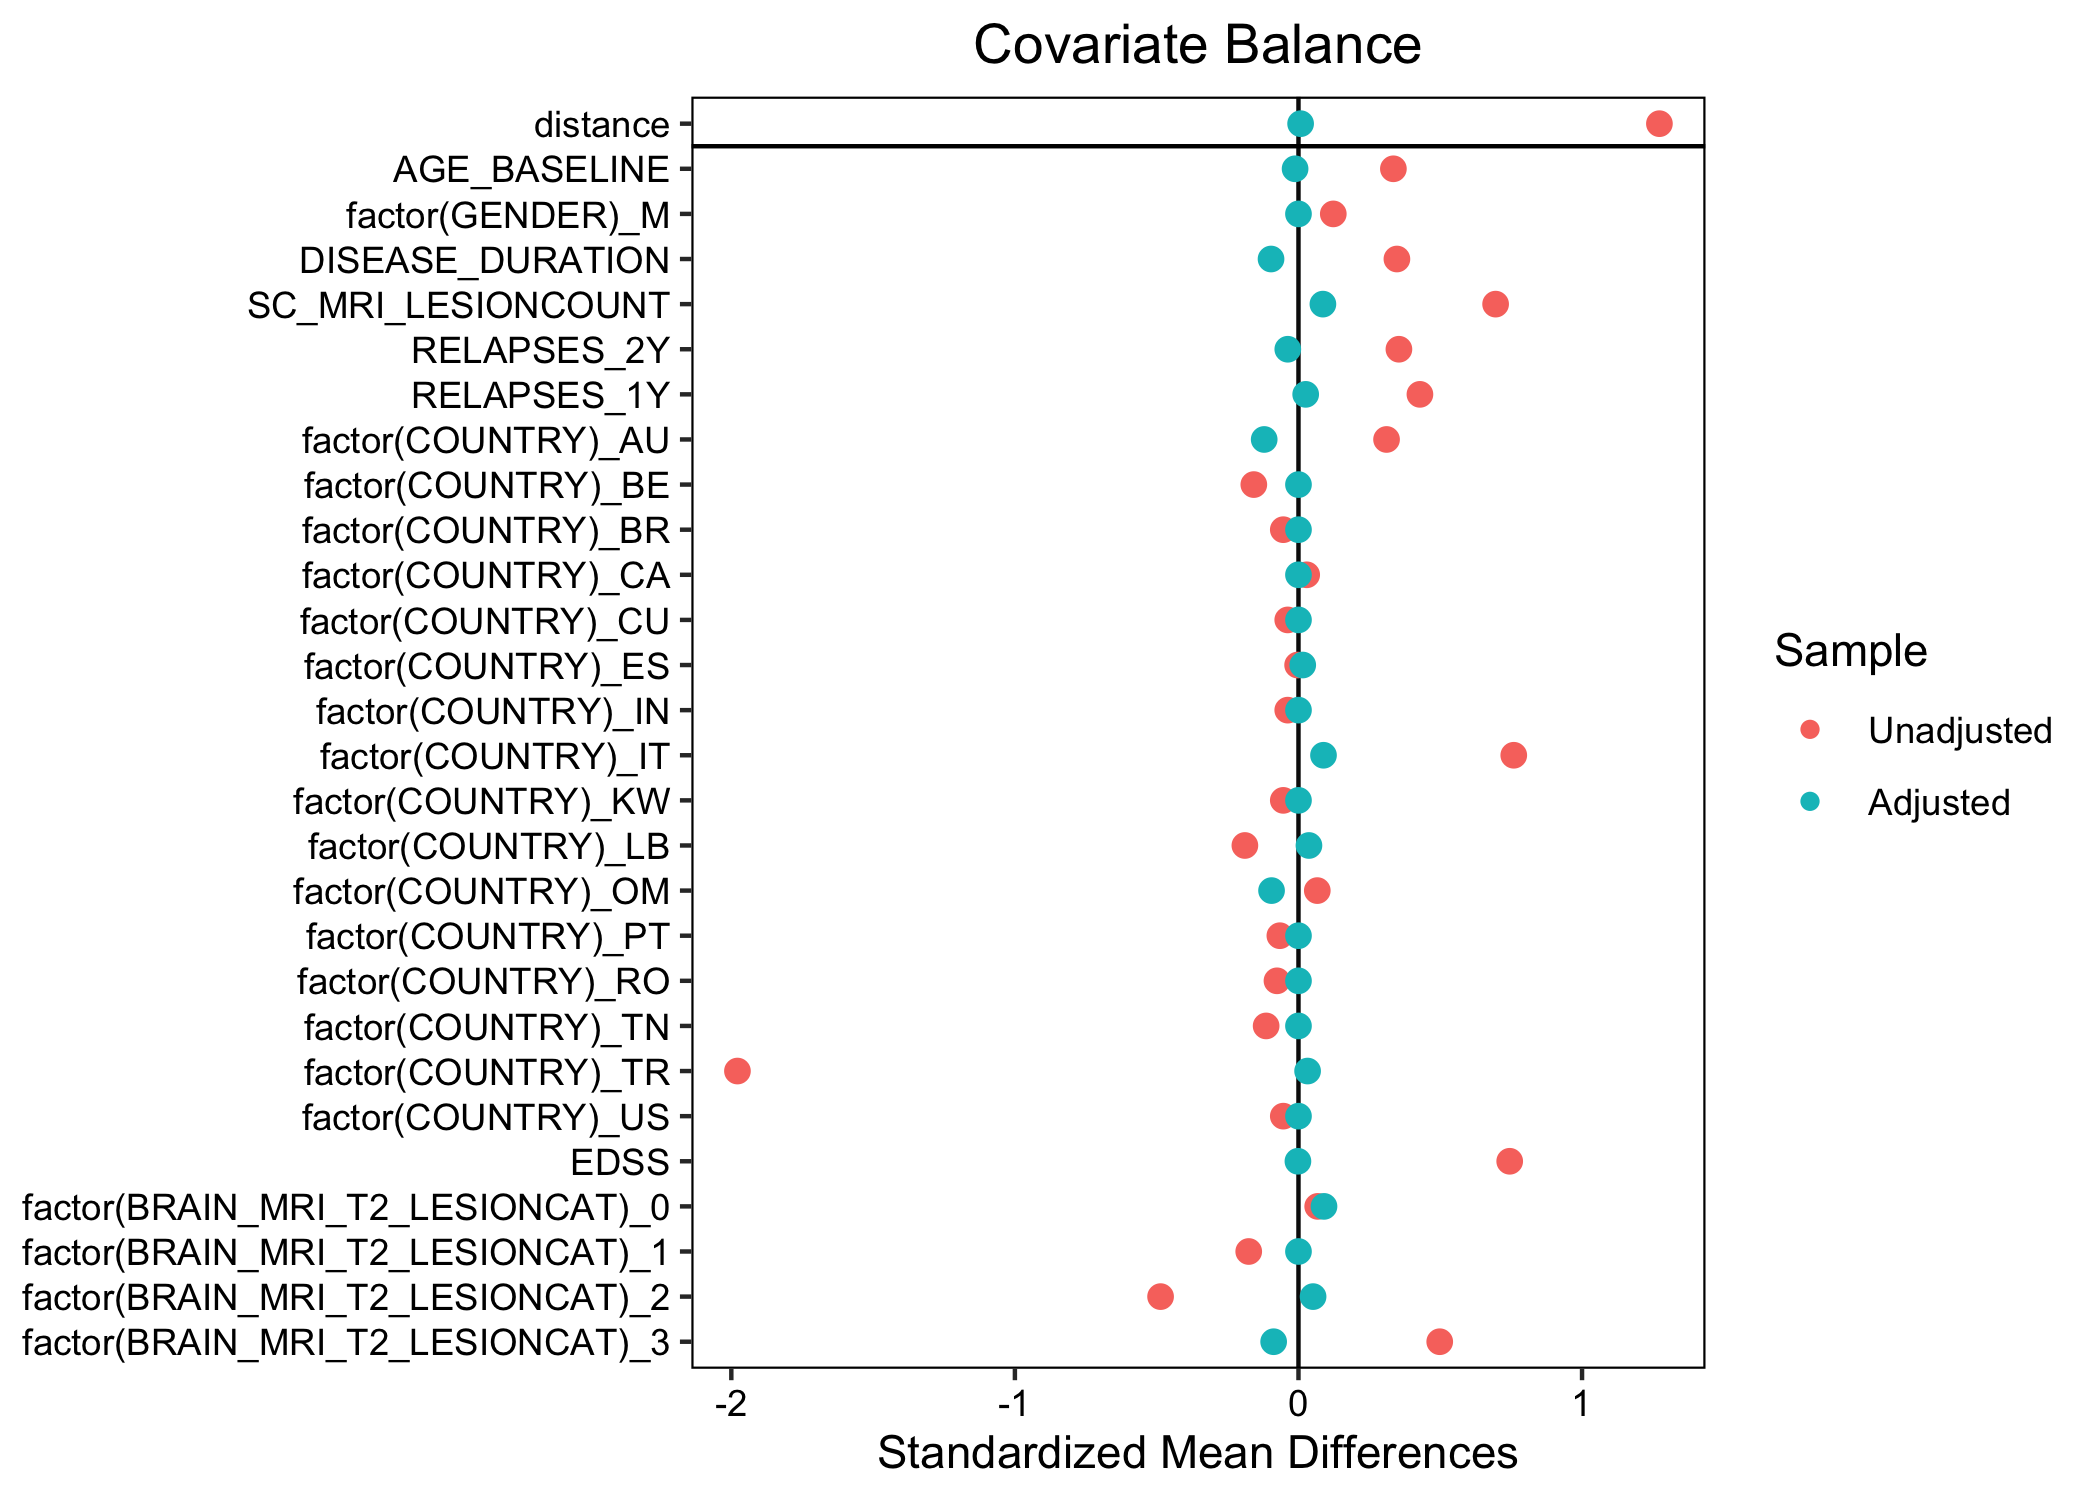
Figure 5.4: Covariate balance before and after matching in the primary analysis
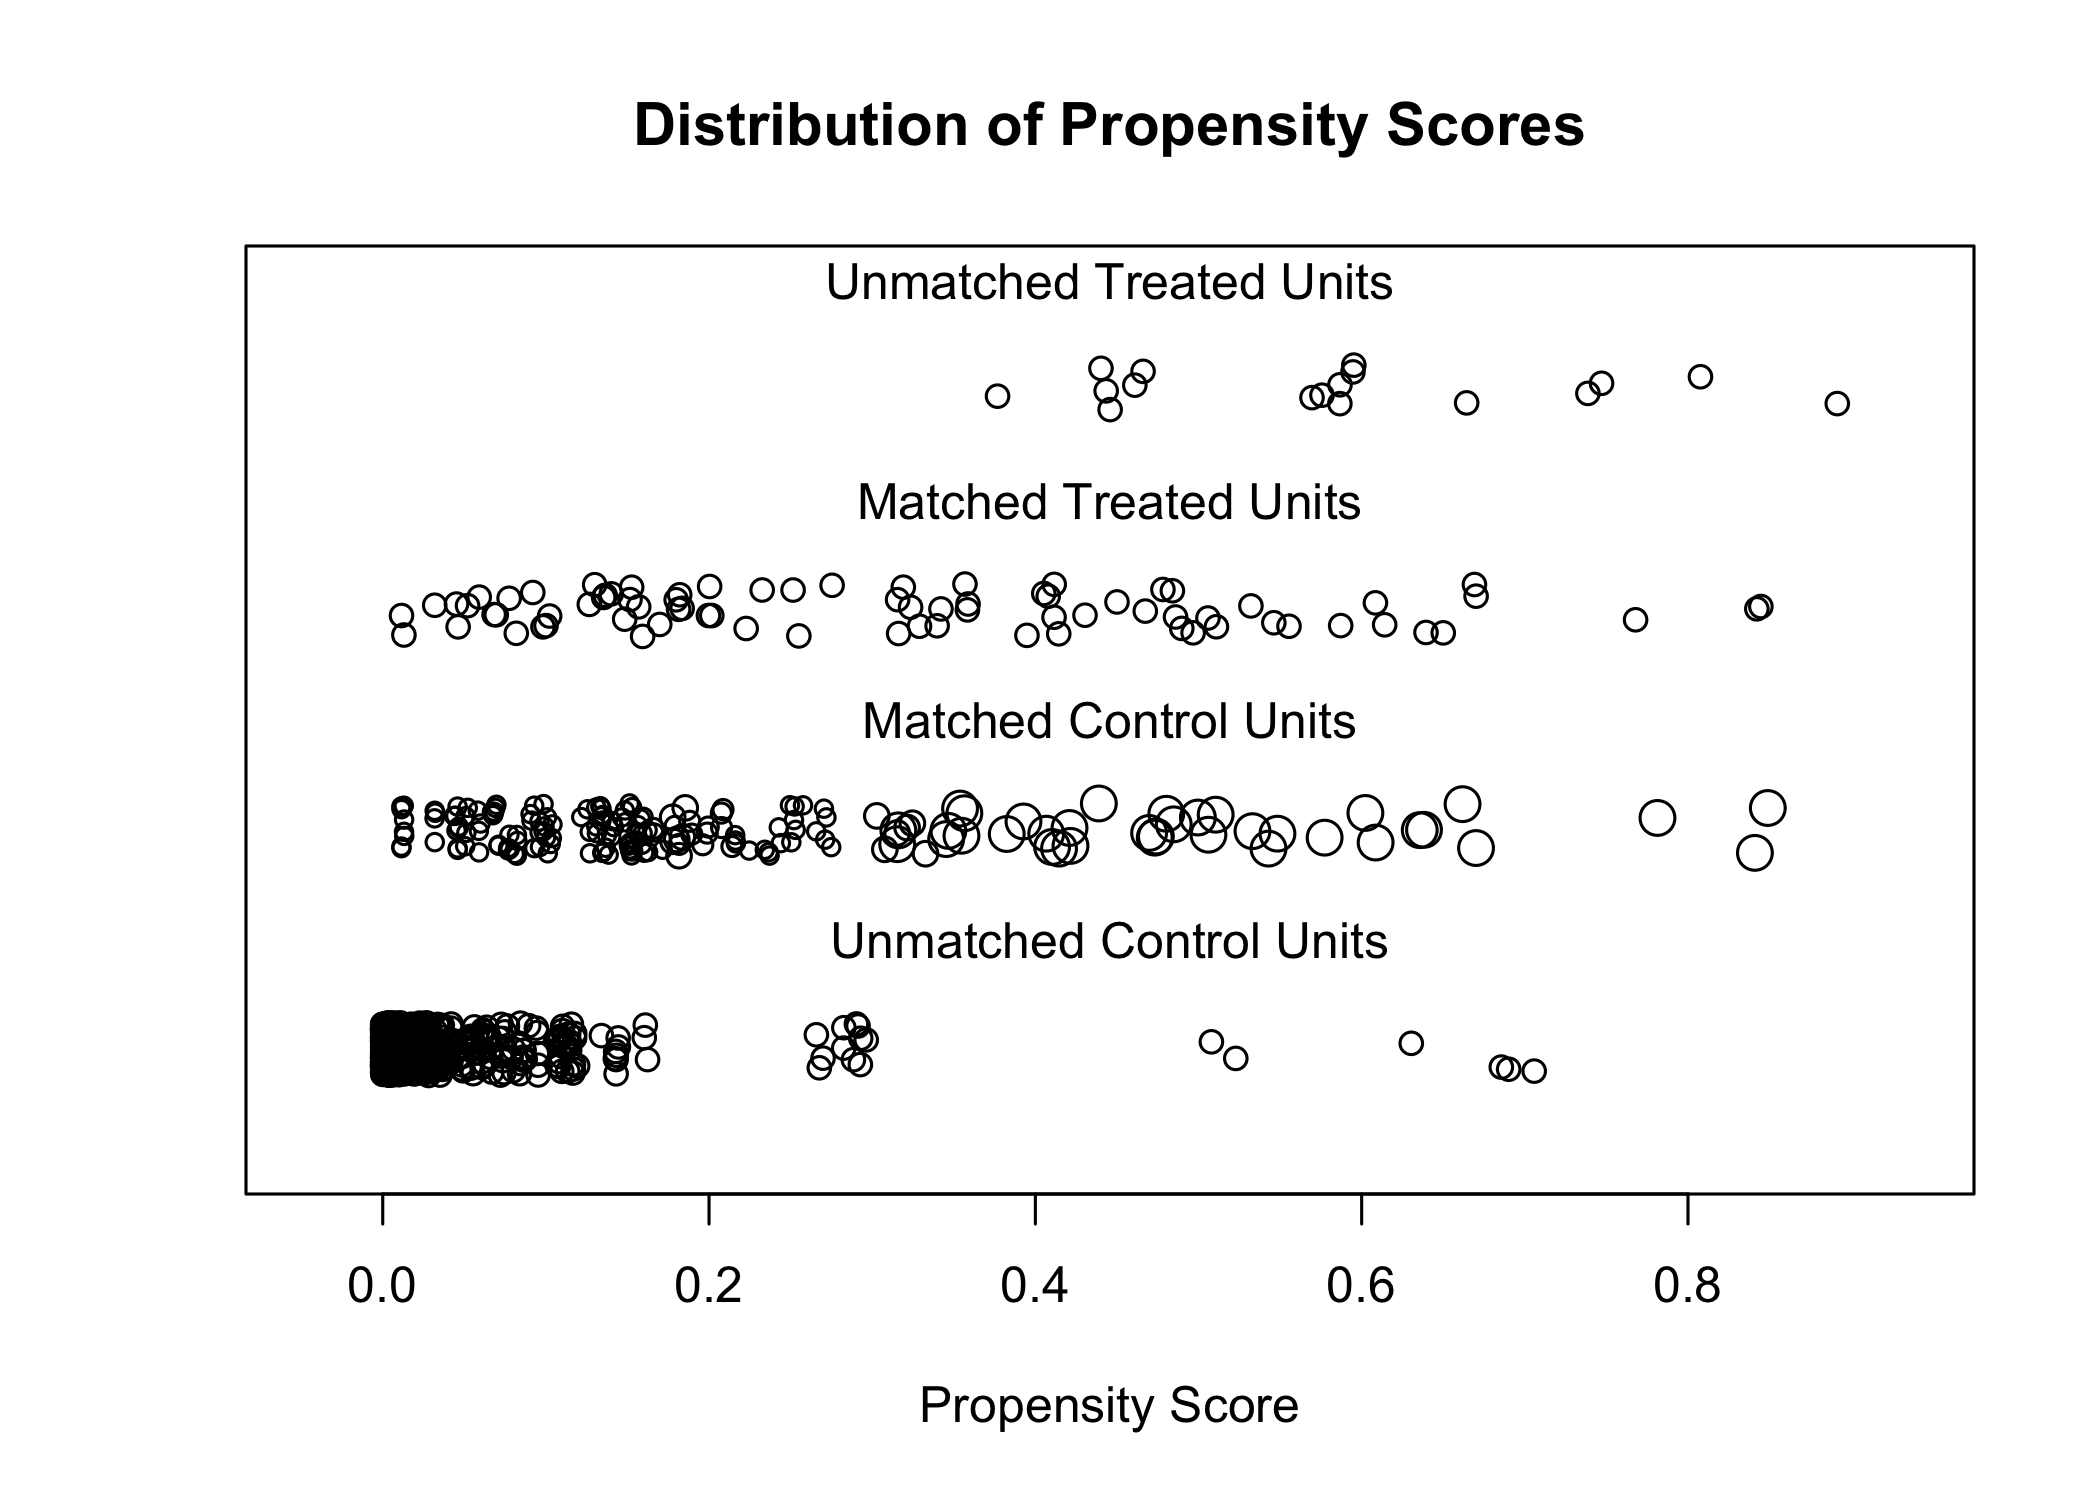
Figure 5.5: Propensity score matching of hDMT and lDMT groups in the primary analysis
S3 - Country of treatment of matched patients
| Characteristic |
Unmatched
|
SMD2 |
Matched
|
SMD2 | ||
|---|---|---|---|---|---|---|
| hDMT N = 941 |
lDMT N = 7831 |
hDMT, N = 771 | lDMT, N = 1841 | |||
| Country | ||||||
| AU | 17 (18%) | 48 (6.1%) | 0.31 | 13 (17%) | 28 (15%) | 0.12 |
| BE | 0 (0%) | 17 (2.2%) | 0.16 | 0 (0%) | 0 (0%) | 0.00 |
| BR | 0 (0%) | 2 (0.3%) | 0.05 | 0 (0%) | 0 (0%) | 0.00 |
| CA | 3 (3.2%) | 21 (2.7%) | 0.03 | 3 (3.9%) | 8 (4.3%) | 0.00 |
| CU | 0 (0%) | 1 (0.1%) | 0.04 | 0 (0%) | 0 (0%) | 0.00 |
| ES | 2 (2.1%) | 17 (2.2%) | 0.00 | 2 (2.6%) | 7 (3.8%) | 0.01 |
| IN | 0 (0%) | 1 (0.1%) | 0.04 | 0 (0%) | 0 (0%) | 0.00 |
| IT | 64 (68%) | 256 (33%) | 0.76 | 52 (68%) | 115 (63%) | 0.09 |
| KW | 0 (0%) | 2 (0.3%) | 0.05 | 0 (0%) | 0 (0%) | 0.00 |
| LB | 3 (3.2%) | 51 (6.5%) | 0.19 | 3 (3.9%) | 10 (5.4%) | 0.04 |
| OM | 1 (1.1%) | 3 (0.4%) | 0.07 | 0 (0%) | 2 (1.1%) | 0.09 |
| PT | 0 (0%) | 3 (0.4%) | 0.07 | 0 (0%) | 0 (0%) | 0.00 |
| RO | 0 (0%) | 4 (0.5%) | 0.08 | 0 (0%) | 0 (0%) | 0.00 |
| TN | 0 (0%) | 9 (1.1%) | 0.11 | 0 (0%) | 0 (0%) | 0.00 |
| TR | 4 (4.3%) | 346 (44%) | 1.98 | 4 (5.2%) | 14 (7.6%) | 0.03 |
| US | 0 (0%) | 2 (0.3%) | 0.05 | 0 (0%) | 0 (0%) | 0.00 |
| 1 Median (Q1, Q3); n (%); Mean (SD) | ||||||
| 2 Standardized mean difference | ||||||
S4 - Patient characteristics and treatments for sensitivity analysis (broad caliper, 80% cutoff)
Characteristics of patients included in this sensitvity analysis
| Characteristic |
Unmatched
|
SMD2 |
Matched
|
SMD2 | ||
|---|---|---|---|---|---|---|
| hDMT N = 1161 |
lDMT N = 9171 |
hDMT, N = 1131 | lDMT, N = 4411 | |||
| Age | 37 (28, 45) | 32 (26, 40) | 0.28 | 37 (29, 46) | 35 (28, 42) | 0.04 |
| Sex | ||||||
| F | 78 (67%) | 650 (71%) | 0.08 | 76 (67%) | 303 (69%) | 0.06 |
| M | 38 (33%) | 267 (29%) | 0.08 | 37 (33%) | 138 (31%) | 0.06 |
| EDSS | 2.5 (2.0, 4.0) | 2.0 (1.0, 2.5) | 0.71 | 2.5 (2.0, 4.0) | 2.0 (1.5, 3.0) | 0.08 |
| Baseline brain lesions | ||||||
| 0 | 3 (2.6%) | 9 (1.0%) | 0.10 | 2 (1.8%) | 6 (1.4%) | 0.01 |
| 1-2 | 1 (0.9%) | 24 (2.6%) | 0.19 | 1 (0.9%) | 7 (1.6%) | 0.03 |
| 3-8 | 10 (8.6%) | 224 (24%) | 0.56 | 10 (8.8%) | 91 (21%) | 0.07 |
| 9+ | 102 (88%) | 660 (72%) | 0.49 | 100 (88%) | 337 (76%) | 0.05 |
| Baseline spinal cord lesions | 3.0 (1.0, 5.5) | 1.0 (0.0, 2.0) | 0.67 | 3.0 (1.0, 5.0) | 2.0 (1.0, 3.0) | 0.07 |
| Relapses in past year | 1.0 (1.0, 2.0) | 1.0 (1.0, 1.0) | 0.38 | 1.0 (1.0, 2.0) | 1.0 (1.0, 2.0) | 0.07 |
| Relapses in past 2 years | 2.0 (1.0, 2.0) | 1.0 (1.0, 2.0) | 0.32 | 2.0 (1.0, 2.0) | 1.0 (1.0, 2.0) | 0.08 |
| Years since first symptoms | 5.4 (7.1) | 3.2 (5.2) | 0.31 | 5.5 (7.2) | 3.8 (6.2) | 0.06 |
| Days between baseline spinal cord MRI and treatment initiation | 44 days (25 days, 69 days) | 32 days (15 days, 62 days) | 44 days (25 days, 70 days) | 39 days (17 days, 70 days) | ||
| Follow-up in years | 2.5 (1.6, 3.4) | 3.1 (1.6, 5.9) | 2.5 (1.6, 3.4) | 3.3 (1.7, 6.2) | ||
| Country | ||||||
| AU | 22 (19%) | 60 (6.5%) | 0.32 | 21 (19%) | 55 (12%) | 0.02 |
| BE | 0 (0%) | 18 (2.0%) | 0.15 | 0 (0%) | 0 (0%) | 0.00 |
| BR | 0 (0%) | 2 (0.2%) | 0.05 | 0 (0%) | 0 (0%) | 0.00 |
| CA | 3 (2.6%) | 25 (2.7%) | 0.01 | 3 (2.7%) | 16 (3.6%) | 0.02 |
| CU | 0 (0%) | 2 (0.2%) | 0.05 | 0 (0%) | 0 (0%) | 0.00 |
| EG | 0 (0%) | 1 (0.1%) | 0.04 | 0 (0%) | 0 (0%) | 0.00 |
| ES | 2 (1.7%) | 23 (2.5%) | 0.06 | 2 (1.8%) | 14 (3.2%) | 0.04 |
| GR | 0 (0%) | 2 (0.2%) | 0.05 | 0 (0%) | 0 (0%) | 0.00 |
| IN | 2 (1.7%) | 1 (0.1%) | 0.12 | 2 (1.8%) | 1 (0.2%) | 0.07 |
| IT | 76 (66%) | 300 (33%) | 0.69 | 74 (65%) | 261 (59%) | 0.00 |
| KW | 0 (0%) | 2 (0.2%) | 0.05 | 0 (0%) | 0 (0%) | 0.00 |
| LB | 5 (4.3%) | 69 (7.5%) | 0.16 | 5 (4.4%) | 38 (8.6%) | 0.01 |
| OM | 1 (0.9%) | 3 (0.3%) | 0.06 | 1 (0.9%) | 3 (0.7%) | 0.02 |
| PT | 0 (0%) | 4 (0.4%) | 0.07 | 0 (0%) | 0 (0%) | 0.00 |
| RO | 0 (0%) | 5 (0.5%) | 0.08 | 0 (0%) | 0 (0%) | 0.00 |
| TN | 0 (0%) | 10 (1.1%) | 0.11 | 0 (0%) | 0 (0%) | 0.00 |
| TR | 5 (4.3%) | 387 (42%) | 1.87 | 5 (4.4%) | 53 (12%) | 0.01 |
| US | 0 (0%) | 3 (0.3%) | 0.06 | 0 (0%) | 0 (0%) | 0.00 |
| CURRENT_CENTER_CODE | ||||||
| AU-007 | 0 (0%) | 1 (0.1%) | 0 (0%) | 1 (0.2%) | ||
| AU-009 | 0 (0%) | 4 (0.4%) | 0 (0%) | 4 (0.9%) | ||
| AU-011 | 2 (1.7%) | 30 (3.3%) | 2 (1.8%) | 26 (5.9%) | ||
| AU-012 | 0 (0%) | 1 (0.1%) | 0 (0%) | 1 (0.2%) | ||
| AU-015 | 0 (0%) | 1 (0.1%) | 0 (0%) | 1 (0.2%) | ||
| AU-017 | 4 (3.4%) | 3 (0.3%) | 4 (3.5%) | 3 (0.7%) | ||
| AU-018 | 0 (0%) | 9 (1.0%) | 0 (0%) | 9 (2.0%) | ||
| AU-021 | 4 (3.4%) | 4 (0.4%) | 4 (3.5%) | 3 (0.7%) | ||
| AU-024 | 2 (1.7%) | 2 (0.2%) | 2 (1.8%) | 2 (0.5%) | ||
| AU-025 | 10 (8.6%) | 3 (0.3%) | 9 (8.0%) | 3 (0.7%) | ||
| AU-030 | 0 (0%) | 2 (0.2%) | 0 (0%) | 2 (0.5%) | ||
| BE-002 | 0 (0%) | 5 (0.5%) | 0 (0%) | 0 (0%) | ||
| BE-003 | 0 (0%) | 1 (0.1%) | 0 (0%) | 0 (0%) | ||
| BE-004 | 0 (0%) | 5 (0.5%) | 0 (0%) | 0 (0%) | ||
| BE-005 | 0 (0%) | 5 (0.5%) | 0 (0%) | 0 (0%) | ||
| BE-006 | 0 (0%) | 2 (0.2%) | 0 (0%) | 0 (0%) | ||
| BR-006 | 0 (0%) | 2 (0.2%) | 0 (0%) | 0 (0%) | ||
| CA-001 | 0 (0%) | 1 (0.1%) | 0 (0%) | 0 (0%) | ||
| CA-005 | 0 (0%) | 2 (0.2%) | 0 (0%) | 2 (0.5%) | ||
| CA-007 | 0 (0%) | 1 (0.1%) | 0 (0%) | 1 (0.2%) | ||
| CA-009 | 1 (0.9%) | 5 (0.5%) | 1 (0.9%) | 3 (0.7%) | ||
| CA-010 | 1 (0.9%) | 15 (1.6%) | 1 (0.9%) | 9 (2.0%) | ||
| CA-013 | 1 (0.9%) | 1 (0.1%) | 1 (0.9%) | 1 (0.2%) | ||
| CU-001 | 0 (0%) | 2 (0.2%) | 0 (0%) | 0 (0%) | ||
| EG-005 | 0 (0%) | 1 (0.1%) | 0 (0%) | 0 (0%) | ||
| ES-001 | 0 (0%) | 1 (0.1%) | 0 (0%) | 0 (0%) | ||
| ES-002 | 0 (0%) | 1 (0.1%) | 0 (0%) | 0 (0%) | ||
| ES-011 | 2 (1.7%) | 18 (2.0%) | 2 (1.8%) | 12 (2.7%) | ||
| ES-013 | 0 (0%) | 1 (0.1%) | 0 (0%) | 1 (0.2%) | ||
| ES-025 | 0 (0%) | 2 (0.2%) | 0 (0%) | 1 (0.2%) | ||
| GR-002 | 0 (0%) | 2 (0.2%) | 0 (0%) | 0 (0%) | ||
| IN-001 | 2 (1.7%) | 1 (0.1%) | 2 (1.8%) | 1 (0.2%) | ||
| IT-002 | 0 (0%) | 1 (0.1%) | 0 (0%) | 1 (0.2%) | ||
| IT-005 | 1 (0.9%) | 3 (0.3%) | 1 (0.9%) | 1 (0.2%) | ||
| IT-012 | 5 (4.3%) | 82 (8.9%) | 5 (4.4%) | 77 (17%) | ||
| IT-017 | 58 (50%) | 103 (11%) | 57 (50%) | 91 (21%) | ||
| IT-025 | 5 (4.3%) | 38 (4.1%) | 5 (4.4%) | 33 (7.5%) | ||
| IT-026 | 7 (6.0%) | 73 (8.0%) | 6 (5.3%) | 58 (13%) | ||
| KW-001 | 0 (0%) | 2 (0.2%) | 0 (0%) | 0 (0%) | ||
| LB-001 | 5 (4.3%) | 69 (7.5%) | 5 (4.4%) | 38 (8.6%) | ||
| OM-001 | 0 (0%) | 1 (0.1%) | 0 (0%) | 1 (0.2%) | ||
| OM-002 | 1 (0.9%) | 2 (0.2%) | 1 (0.9%) | 2 (0.5%) | ||
| PT-004 | 0 (0%) | 4 (0.4%) | 0 (0%) | 0 (0%) | ||
| RO-002 | 0 (0%) | 5 (0.5%) | 0 (0%) | 0 (0%) | ||
| TN-002 | 0 (0%) | 10 (1.1%) | 0 (0%) | 0 (0%) | ||
| TR-005 | 1 (0.9%) | 64 (7.0%) | 1 (0.9%) | 8 (1.8%) | ||
| TR-006 | 0 (0%) | 25 (2.7%) | 0 (0%) | 6 (1.4%) | ||
| TR-007 | 0 (0%) | 1 (0.1%) | 0 (0%) | 0 (0%) | ||
| TR-011 | 3 (2.6%) | 223 (24%) | 3 (2.7%) | 27 (6.1%) | ||
| TR-012 | 1 (0.9%) | 64 (7.0%) | 1 (0.9%) | 10 (2.3%) | ||
| TR-013 | 0 (0%) | 10 (1.1%) | 0 (0%) | 2 (0.5%) | ||
| US-002 | 0 (0%) | 3 (0.3%) | 0 (0%) | 0 (0%) | ||
| 1 Median (Q1, Q3); n (%); Mean (SD) | ||||||
| 2 Standardized mean difference | ||||||
S5 - Treatment bars all DMTs
This figure is not included as a supplement to the original publication and has been created later for the purpose of the thesis.
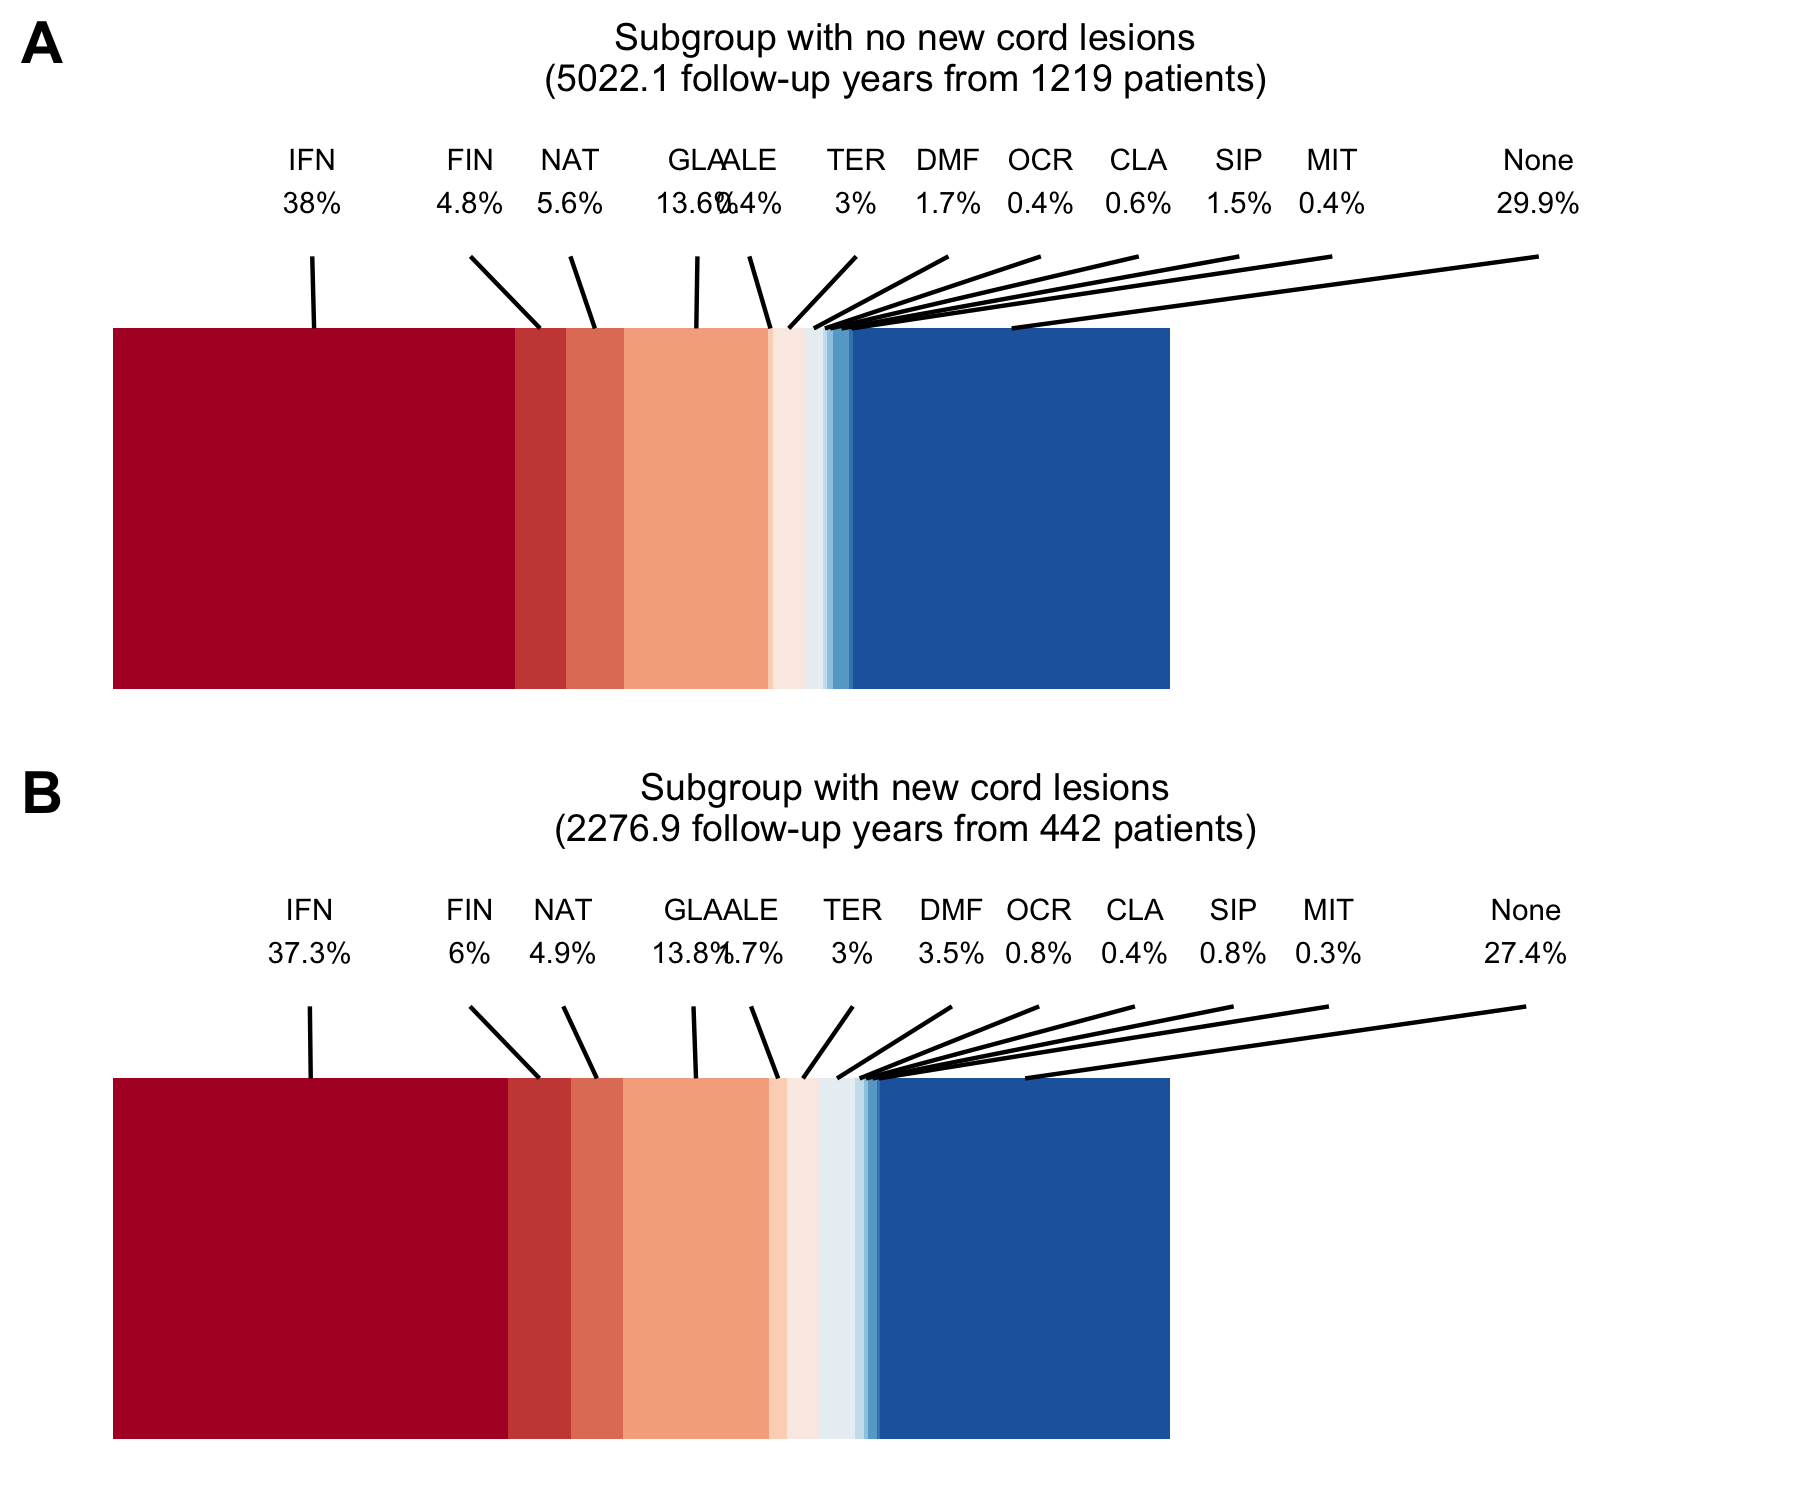
Figure 5.6: DMT usage during follow-up as proportion of follow-up time with intermediate-efficacy DMTs included. AZA = azathioprine, ALE = alemtuzumab, CLA = cladribine, DMF = dimethylfumarate, NAT = natalizumab, FIN = fingolimod, GLA = glatiramer acetate, IVIG = immunoglobulins, IFN = interferons, MIT = mitoxantron, MTX = methotrexate, OFA = ofatumumab, OCR = ocrelizumab, RTX = rituximab, PON = ponesimod, ONA = ozanimod, SIP = siponimod, TER = teriflunomide .